. 2009 Jun;27(6):1330-46.
doi: 10.1002/stem.80.

Activin A is essential for neurogenesis following neurodegeneration

Affiliations
Free PMC article

Activin A is essential for neurogenesis following neurodegeneration

Andrea Abdipranoto-Cowley et al. Stem Cells. 2009 Jun.
Free PMC article

Abstract

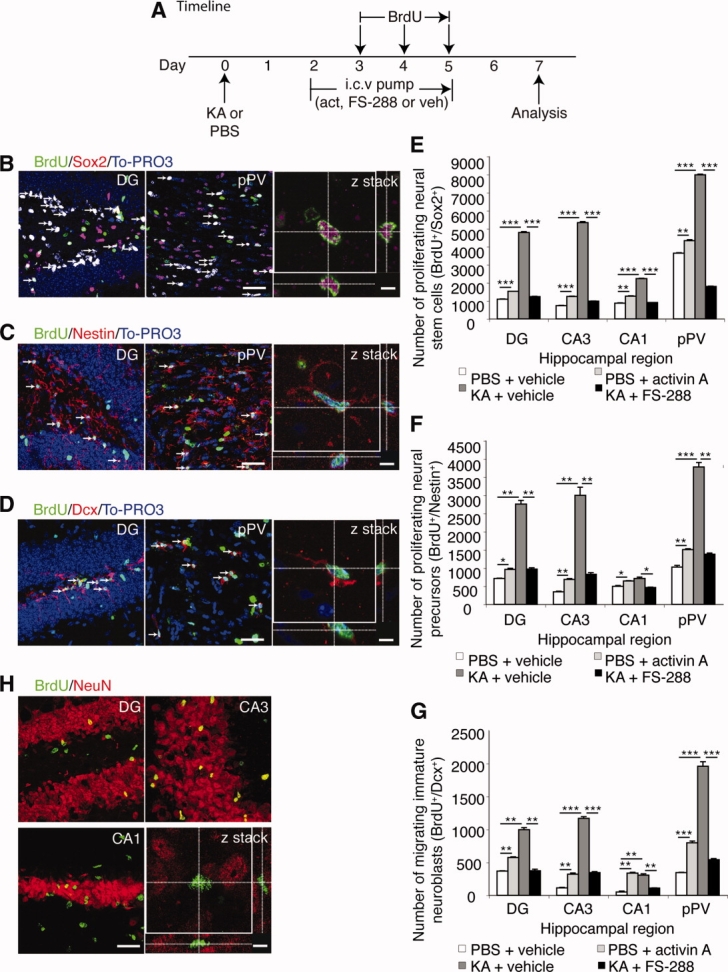
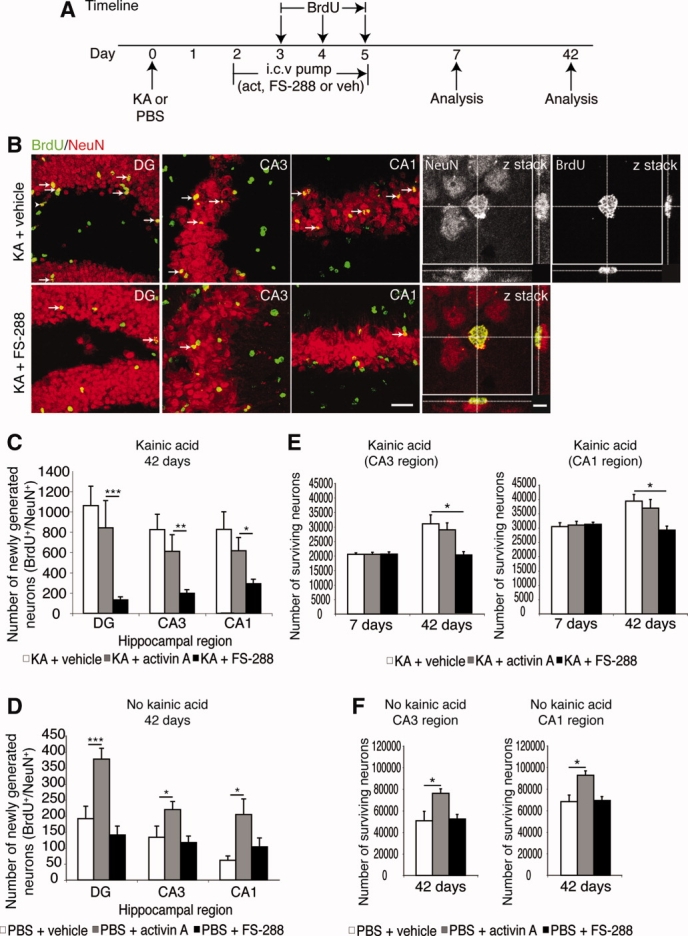
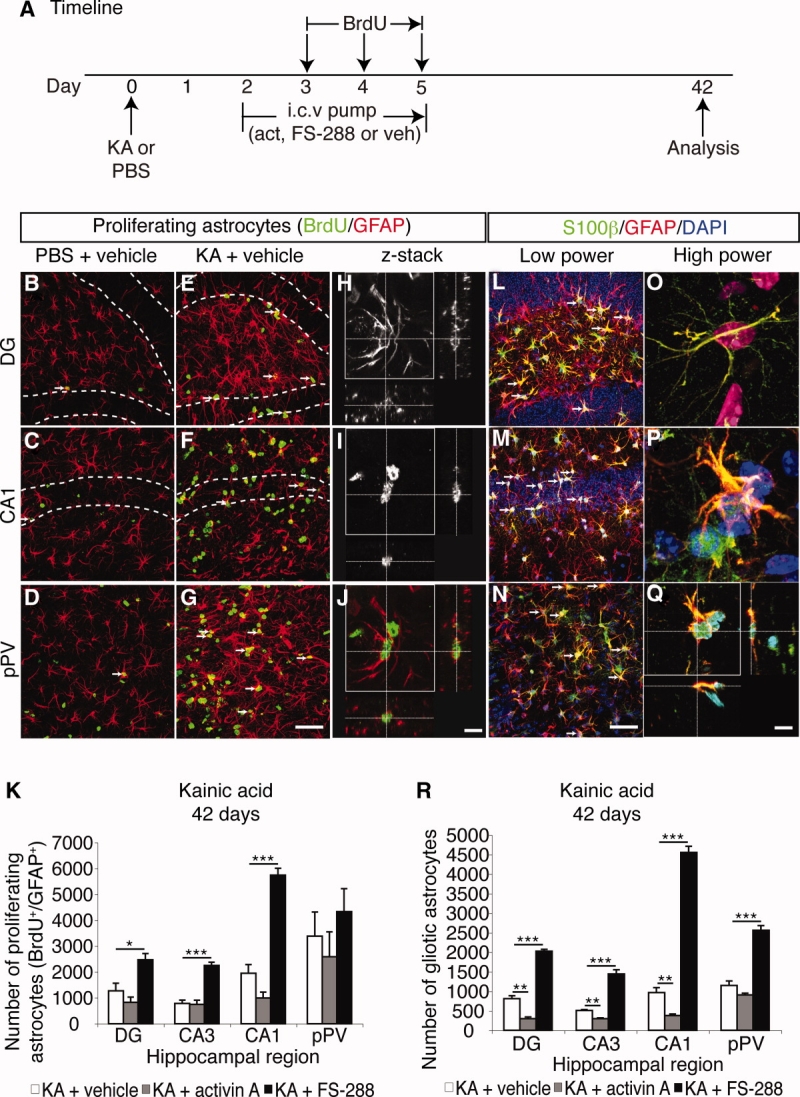
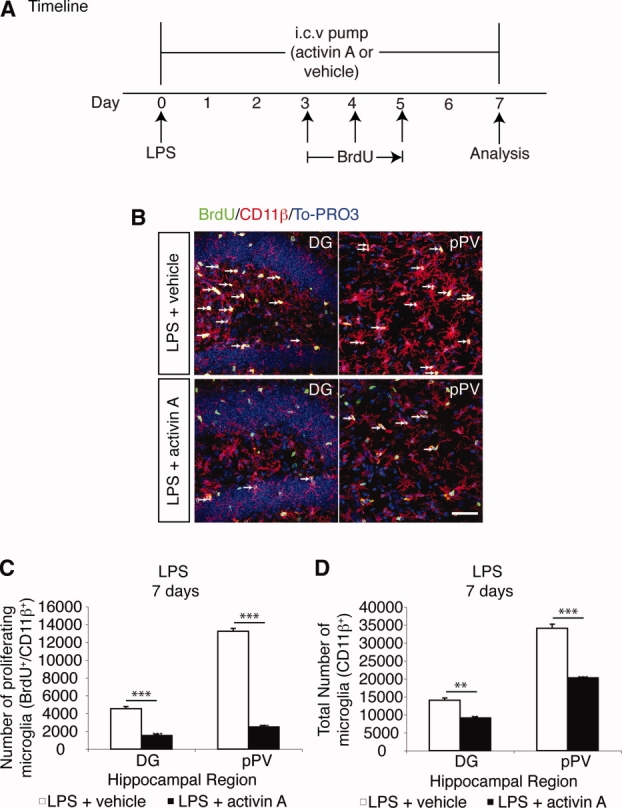
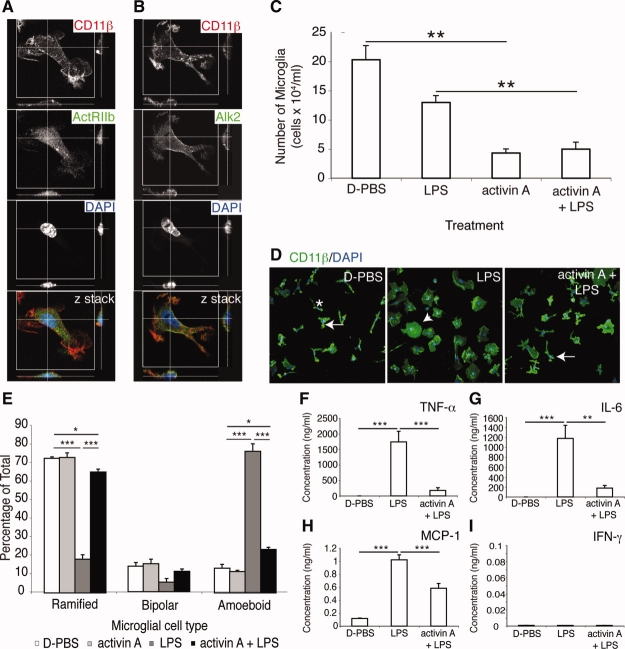
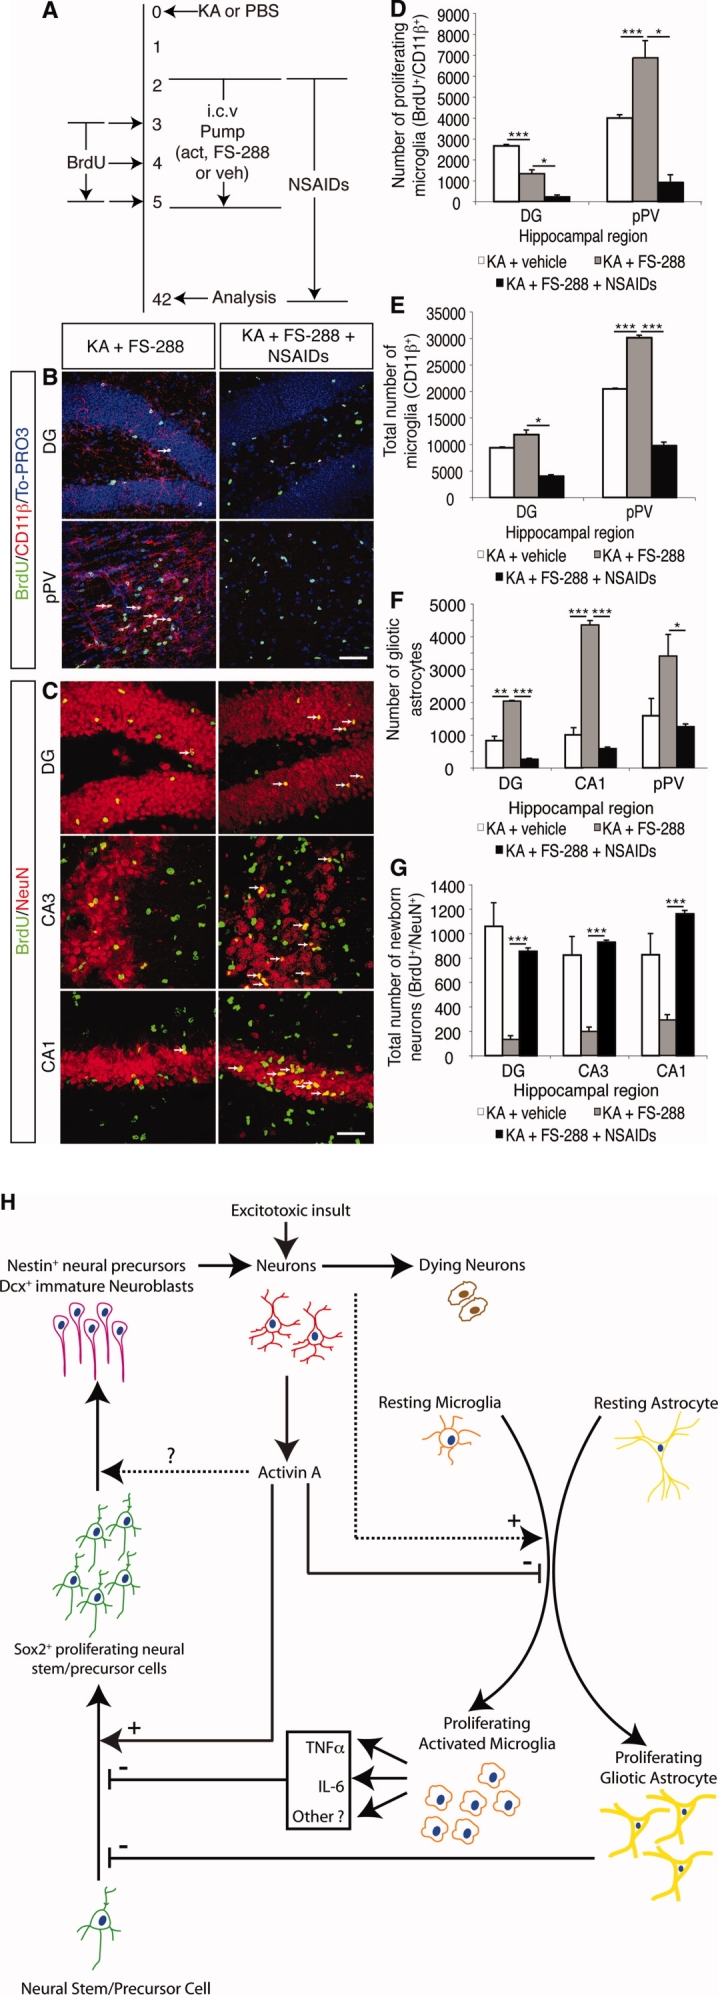
It has long been proposed that excitotoxicity contributes to nerve cell death in neurodegenerative diseases. Activin A, a member of the transforming growth factor-beta superfamily, is expressed by neurons following excitotoxicity. We show for the first time that this activin A expression is essential for neurogenesis to proceed following neurodegeneration. We found that intraventricular infusion of activin A increased the number of newborn neurons in the dentate gyrus, CA3, and CA1 layers of the normal adult hippocampus and also, following lipopolysaccharide administration, had a potent inhibitory effect on gliosis in vivo and on microglial proliferation in vivo and in vitro. Consistent with the role of activin A in regulating central nervous system inflammation and neurogenesis, intraventricular infusion of follistatin, an activin A antagonist, profoundly impaired neurogenesis and increased the number of microglia and reactive astrocytes following onset of kainic acid-induced neurodegeneration. These results show that inhibiting endogenous activin A is permissive for a potent underlying inflammatory response to neurodegeneration. We demonstrate that the anti-inflammatory actions of activin A account for its neurogenic effects following neurodegeneration because co-administration of nonsteroidal anti-inflammatory drugs reversed follistatin's inhibitory effects on neurogenesis in vivo. Our work indicates that activin A, perhaps working in conjunction with other transforming growth factor-beta superfamily molecules, is essential for neurogenesis in the adult central nervous system following excitotoxic neurodegeneration and suggests that neurons can regulate regeneration by suppressing the inflammatory response, a finding with implications for understanding and treating acute and chronic neurodegenerative diseases.


Figures

Figure 1
Figure 1
Activin A induces neural stem cell and precursor proliferation in the adult injured and intact hippocampus. (A): Experimental timeline: On day 0 animals received a single i.c.v. injection of KA or PBS control. Starting on day 2, an i.c.v. infusion of activin A, FS-288, or vehicle began and was continued for 3 days via an osmotic micropump. Animals received three times daily i.p. injections of BrdU beginning at 7 a.m. for the 3 days indicated. On day 7 the tissue was harvested for analysis. (BD): Images of (B) proliferating multipotential neural stem cells co-expressing BrdU (green) and Sox2 (red), (C) proliferating neural precursor cells co-expressing BrdU (green) and nestin (red), and (D) proliferating immature migrating neuroblasts co-expressing BrdU (green) and doublecortin (red). For all confocal images, low-power scale bar = 50 μm and high-power scale bar = 5 μm. (E–G): Quantification of proliferating cells revealed that compared to their respective vehicle-treated controls [KA injected with vehicle (dark gray bars, n = 5); PBS injected with vehicle (white bars, n = 5)], infusion of FS-288 in KA-injected animals (n = 5, black bars) inhibited proliferation, whereas infusion of activin A in PBS-injected animals (n = 5, light gray bars) increased proliferation of (E) multipotential neural stem cells, (F) neural precursors, and (G) immature migrating neuroblasts in the DG, CA3, CA1, and pPV area. (H): Seven days after KA low- and high-power (confocal z stack) images show that cells did not co-express NeuN (red) and BrdU (green). Values for all graphs are mean ± SEM. ∗, p < .025; ∗∗, p < .005; ∗∗∗, p < .0005 (independent two-sample t test with Bonferroni correction). Abbreviations: BrdU, bromodeoxyuridine; Dcx, doublecortin; DG, dentate gyrus; FS-288, follistatin-288; i.c.v., intracerebroventricular; KA, kainic acid; NeuN, neuronal nuclei; PBS, phosphate buffered saline; pPV, posterior periventricular area.
Figure 2
Figure 2
Activin A regulates long-term neurogenesis in the adult injured and intact hippocampus. (A): Experimental timeline (for details refer to Fig. 1). Tissue was analyzed at 7 days or 42 days. (B): Forty-two days after KA injection newborn neurons co-express the neuronal marker, NeuN (red), and the proliferative marker, BrdU (green), although less newborn neurons were seen in KA-treated animals that received FS-288 compared to animals that did not receive FS-288. Low-power scale bar = 50 μm and high-power scale bar = 5 μm. (C): Quantification revealed that infusion of FS-288 in KA-injected animals (n = 10, black bars) inhibited neurogenesis in the DG, CA3, and CA1, whereas infusion of activin A in KA-injected animals (n = 10, gray bars) had no effect on the number of new neurons compared to KA-injected controls (n = 11, white bars). (D): There was, however, increased neurogenesis in the DG, CA3, and CA1 regions of the dorsal intact hippocampus in activin A-treated animals (n = 10, gray bars), whereas (FS-288)-treated animals had no effect on neurogenesis (n = 10, black bars) compared to controls (n = 10, white bars). (E): Administration of activin A or FS-288, 2 days after KA-induced injury, did not alter neuron survival when administered by our protocol since there were no differences in the total neuron population observed in the CA3 or CA1 regions 7 days after KA in animals that received infusions of activin A (n = 8, gray bars) or FS-288 (n = 8, black bars) compared to KA-injected controls (n = 8, white bars). However, FS-288 administration prevented the subsequent increase in total neuron population observed 42 days after the KA-induced neurodegeneration, suggesting endogenous activin A expression increases total neuron population after KA neurodegeneration. (F): Meanwhile, activin A infusion following PBS injection (n = 8, gray bars) increased the total neuron population 42 days later in the CA3 and CA1 compared to their respective vehicle-treated controls (n = 8, white bars). Infusion of FS-288 following PBS injection (n = 8, black bars) had no effect on the total neuron population. Values for all graphs are mean ± SEM. ∗, p < .025; ∗∗, p < .005; ∗∗∗, p < .0005 (independent two-sample t test with Bonferroni correction). Abbreviations: BrdU, bromodeoxyuridine; DG, dentate gyrus; FS-288, follistatin-288; KA, kainic acid; NeuN, neuronal nuclei; PBS, phosphate buffered saline.
Figure 3
Figure 3
Activin A inhibits astrocyte proliferation in the injured hippocampus. (A): Experimental timeline. (B–G): Increased astrocyte proliferation (arrows) was observed in the DG, CA1 and pPV of animals that received KA compared to animals that did not receive KA. Scale bar = 50 μm. (H–J): Confocal z-stack images showed that proliferating astrocytes (J, overlay of H and I) co-expresss GFAP (red, H) and BrdU (green, I). Scale bar = 5 μm. K, Quantification revealed enhanced astrocyte proliferation in the DG, CA3, CA1 and pPV regions of the dorsal hippocampus in KA-injected animals that received FS-288 (n = 7, black bars) compared to KA-injected controls (n = 7, white bars), while, infusion of activin A following KA injection (n = 7, grey bars) had no significant effect on astrocyte proliferation compared to KA control animals. L–Q, Analysis of astrocytes with S100β and GFAP revealed extensive gliosis (arrows) in the DG, CA1 and pPV following KA-induced neurodegeneration. Scale bar = 50 μm. (O–Q): Images of astrocyte morphology show that (O) quiescent astrocytes possess long, thin processes while, (P) gliotic astrocytes displayed cellular hypertrophy and a shortening or thickening of processes and (Q) co-expressed BrdU (green), GFAP (red) and DAPI (blue). Scale bar = 5 μm. R, Quantification of astrocytes that co-expressed BrdU and GFAP and exhibited cellular hypertrophy revealed that infusion of FS-288 following KA injection (n = 7, black bars) enhanced gliosis, while infusion of activin A following KA injection (n = 7, grey bars) inhibited gliosis in the DG, CA3, CA1 and pPV regions of the dorsal hippocampus compared to KA-injected control animals (n =7, white bars). Values for all graphs as mean ± SEM. *: p < 0.025, **: p < 0.005, ***: p < 0.0005 (Independent two sample t-test with Bonferroni correction). Abbreviations: BrdU, bromodeoxyuridine; DAPI, 4′,6-diamidino-2-phenylindole; DG, dentate gyrus; FS-288, follistatin-288; GFAP, glial fibrillary acidic protein; KA, kainic acid; PBS, phosphate buffered saline; pPV, posterior periventricular area.
Figure 4
Figure 4
Activin A inhibits microglial proliferation in the intact and injured hippocampus. (A): Experimental timeline. (B): Proliferating microglia co-express the microglial marker, CD11β (red), and the proliferative cell marker, BrdU (green), counterstained with DAPI (blue). Low-power scale bar = 50 μm and high-power scale bar = 5 μm. (C): Quantification revealed that the number of proliferating microglia (BrdU+/CD11β+) over 3 days of BrdU treatment in the DG was inhibited by infusion of activin A (n = 5, gray bars) and FS-288 (n = 5, black bars), compared to controls (n = 5, white bars), whereas in the pPV, infusion of FS-288 in KA-injected animals stimulated microglial proliferation. (D): Infusion of activin A (n = 5, gray bars) or FS-288 (n = 5, black bars) in KA-injected animals did not change in the total microglial population in the DG compared to controls (n = 5, white bars), whereas in the pPV of KA-injected animals, FS-288 led to an increase in the total microglial population when compared to controls. (E): Infusion of activin A in animals that did not receive KA (n = 5, black bars) inhibited microglial proliferation over 3 days of BrdU in the DG but had no further effects on microglial proliferation in the pPV compared to controls (n = 7, white bars). (F): Infusion of activin A in animals that did not receive KA (n = 5, black bars) had no effect on the total microglial population in the DG and pPV despite decreased microglial proliferation in the DG compared to controls (n = 5, white bars). Values for all graphs are mean ± SEM. ∗, p < .025; ∗∗, p < .005; ∗∗∗, p < .0005 (independent two-sample t test with Bonferroni correction). Abbreviations: BrdU, bromodeoxyuridine; DAPI, 4′,6-diamidino-2-phenylindole; DG, dentate gyrus; FS-288, follistatin-288; KA, kainic acid; PBS, phosphate buffered saline; pPV, posterior periventricular area.
Figure 5
Figure 5
Activin A possesses anti-inflammatory properties in vivo. (A): Experimental timeline. On day 0 animals received a single i.c.v. injection of LPS. Also on day 0, a 7-day infusion of activin A or vehicle was initiated via osmotic micropump. During this period, animals received three times daily i.p. injections of BrdU for 3 days, beginning at 7:00 a.m. on day 3. On day 7 the tissue was harvested for immunohistochemical analysis. (B): Activin A infusion decreased the number of microglia (red) and the number of proliferating microglia (arrows, white) that co-labeled with BrdU (green), CD11β (red), and 4′,6-diamidino-2-phenylindole (blue), in the DG and pPV of LPS-injected animals that received activin A infusion, compared to LPS-injected animals that did not receive activin A. Scale bars = 50 μm. (C, D): Quantification supported observations that activin A in LPS-injected animals (n = 5, black bars) (C) inhibited microglial proliferation and (D) decreased the total microglial population in the DG and pPV compared to control animals (n = 5, white bars). Values for all graphs are mean ± SEM. ∗, p < .025; ∗∗, p < .005; ∗∗∗, p < .0005 (independent two-sample t test with Bonferroni correction). Abbreviations: BrdU, bromodeoxyuridine; DG, dentate gyrus; i.c.v., intracerebroventricular; KA, kainic acid; LPS, lipopolysaccharide; pPV, posterior periventricular area.
Figure 6
Figure 6
Activin A has direct anti-inflammatory effects on microglia in vitro. (A, B): Confocal z stack analysis revealed that CD11β+ microglia expressed the (A) type II receptor, ActRIIb, and the (B) type I receptor, Alk2, on the cell surface. (C): Total viable microglial counts showed that activin A decreases the microglial population in the presence and absence of LPS compared to control-treated microglial cells (LPS or D-PBS alone). (D): Microglial cells stimulated with LPS exhibited amoeboid (activated) morphology (arrowhead) compared to microglial cells treated with D-PBS control that exhibited ramified (resting) morphology (arrow). Microglial cells that were pretreated with activin A prior to LPS stimulation exhibited ramified (resting) morphology (arrow) comparable to microglial cells treated with D-PBS control. There were also microglial cells that exhibited bipolar morphology (asterisk). (E): Quantification of microglial cell subtypes revealed that stimulation with LPS (n = 3 experiments, light gray bars) increased the acquisition of amoeboid morphology, indicating microglial activation, compared to control-treated microglia (n = 3 experiments, white bars) exhibiting ramified (resting) morphology. Treatment of microglial cells with activin A (n = 3 experiments, dark gray bars) reversed the effects of LPS as groups treated with LPS and activin A showed similar levels of ramified (resting) microglial cells and amoeboid (activated) microglial cells as seen in microglia that were not stimulated with LPS. Treatment with activin A alone (n = 3 experiments, black bars) had no effect on microglial states compared to control-treated cells. There was also no change in microglial cells exhibiting bipolar morphology. (F–I): LPS stimulates release of (F) TNFα, (G) IL-6, and (H) MCP-1 but not (I) IFN-γ from cultured microglial cells, all of which are significantly inhibited by pretreatment with activin A. Values are mean ± SEM. ∗, p < .025; ∗∗, p < .005; ∗∗∗, p < .0005 (independent two-sample t test with Bonferroni correction). Abbreviations: ActRIIb, activin receptor IIb; Alk2 (ActRI), activin-like kinase receptor 2; DAPI, 4′,6-diamidino-2-phenylindole; D-PBS, Dulbecco's phosphate buffered saline; INFγ, interferon-γ; IL-6, interleukin-6; LPS, lipopolysaccharide; MCP-1, monocyte chemoattractant protein-1; PBS, phosphate buffered saline; TNFα, tumor necrosis factor-α.
Figure 7
Figure 7
NSAIDs inhibit microglial proliferation, inhibit gliosis, and restore neurogenesis in (FS-288)-treated KA-injected animals. (A): Experimental timeline. Some animals received NSAIDs beginning on day 2, prior to implantation of osmotic micropumps, and ending on day 42 when tissue was harvested. (B): Immunohistochemistry and confocal analysis of proliferating microglial cells in (FS-288)-treated, KA-injected animals that did or did not receive NSAIDs. Scale bar = 50 μm. (C): Immunohistochemistry and confocal analysis of newborn neurons (arrows) in the DG, CA3, and CA1 regions in (FS-288)-treated, KA-injected animals that did or did not receive NSAIDs. Scale bar = 50 μm. (D, E): Quantification of microglial populations revealed that NSAIDs in (FS-288)-treated, KA-injected animals (n = 5, black bars) inhibited (D) microglial proliferation and reduced (E) the total microglial population in the DG and pPV compared to (FS-288)-treated, KA-injected animals that did not receive NSAIDs (n = 5, gray bars). (F): Quantification of gliosis, defined as the number of proliferating astrocytes exhibiting gliotic morphology, revealed that NSAID treatment of (FS-288)-treated, KA-injected animals (n = 5, black bars) decreased the extent of gliosis in the DG, CA1, and pPV compared to (FS-288)-treated, KA-injected animals that did not receive NSAIDs (n = 5, gray bars). (G): Quantification showed significant recovery of neurogenesis in the DG, CA3, and CA1 regions of (FS-288)-treated, KA-injected animals that received NSAIDs (n = 5, black bars) compared to (FS-288)-treated, KA-injected animals that did not receive NSAIDs (n = 10, gray bars). (H): Local activin A expression following injury acts as an anti-inflammatory, inhibiting gliosis and microglial activation while promoting neurogenesis. Neurodegeneration activates microglia, possibly in part through activation of TLR2 and TLR4 receptors (see Discussion), and also directly and/or indirectly leads to a gliotic response by astrocytes. Microglial activation leads to release of pro-inflammatory cytokines, including TNF-α and IL-6. Cytokines inhibit neural stem/precursor cell proliferation and, consequently, neurogenesis. However, increased activin A expression from surviving neurons is a potent anti-inflammatory agent that inhibits proliferation and activation of microglia and either directly and/or indirectly inhibits the gliotic response by astrocytes. This in turn is permissive for neurogenesis. Activin A also regulates neurogenesis by stimulating neural stem/precursor proliferation, leading to increased number of immature neuroblasts and, ultimately, increased neurogenesis. It is uncertain whether activin A also alters differentiation of neural stem/precursor cells. This model does not exclude the possibility that other transforming growth factor-β/bone morphogenetic protein molecules act in concert with activin A; however, their actions would also be, at least in part, anti-inflammatory (see Discussion). The fact that activin A is expressed by neurons raises the possibility of an internal response system, where injured neurons signal for anti-inflammatory action. This model is of relevance for understanding not only postinjury response within the central nervous system but also the environment of neurodegenerative disease. Values are mean ± SEM. ∗, p < .025; ∗∗, p < .005; ∗∗∗, p < .0005 (independent two-sample t test with Bonferroni correction). Abbreviations: BrdU, bromodeoxyuridine; Dcx, doublecortin; DG, dentate gyrus; FS-288, follistatin-288; IL-6, interleukin-6; KA, kainic acid; NeuN, neuronal nuclei; NSAIDs, nonsteroidal anti-inflammatory drugs; PBS, phosphate buffered saline; pPV, posterior periventricular area; TLR, toll-like receptor; TNFα, tumor necrosis factor-α.

References

    1. Zhao C, Deng W, Gage FH. Mechanisms and functional implications of adult neurogenesis. Cell. 2008;132:645–660. - PubMed
    1. Lledo PM, Alonso M, Grubb MS. Adult neurogenesis and functional plasticity in neuronal circuits. Nat Rev Neurosci. 2006;7:179–193. - PubMed
    1. Abdipranoto A, Wu A, Stayte S, et al. The role of neurogenesis in neurodegenerative diseases and its implications for therapeutic development. CNS Neurol Disord Drug Targets. 2008;7:187–210. - PubMed
    1. Ikonomidou C, Turski L. Excitotoxicity and neurodegenerative diseases. Curr Opin Neurol. 1995;8:487–497. - PubMed
    1. Wang Q, Yu S, Simonyi A, et al. Kainic acid-mediated excitotoxicity as a model for neurodegeneration. Mol Neurobiol. 2005;31:3–16. - PubMed

Publication types

MeSH terms