

Reprogramming retinal pigment epithelium to differentiate toward retinal neurons with Sox2
- PMID: 19489100
- PMCID: PMC2746631
- DOI: 10.1002/stem.48
Reprogramming retinal pigment epithelium to differentiate toward retinal neurons with Sox2
Abstract
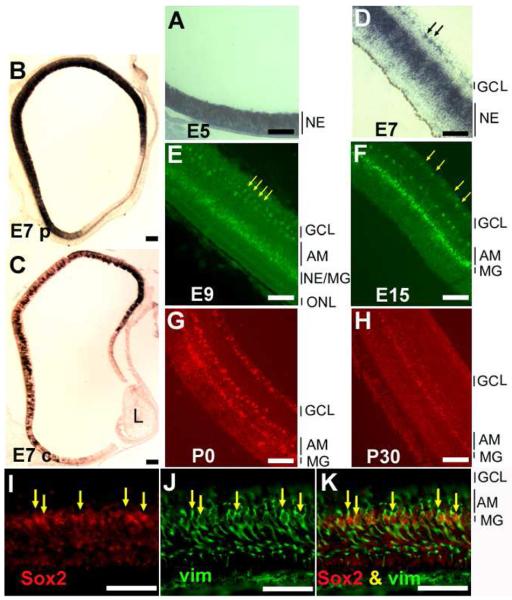
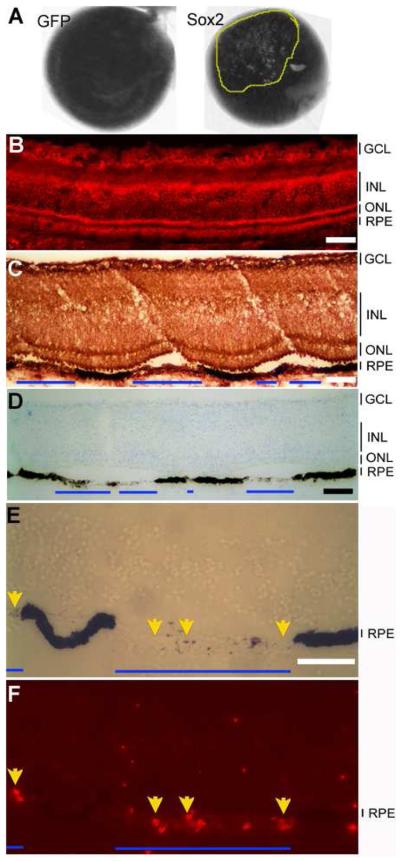
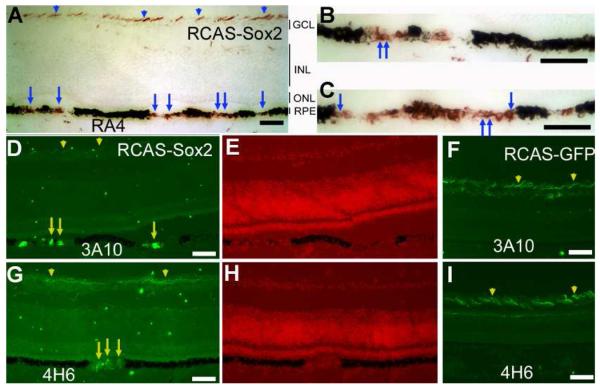
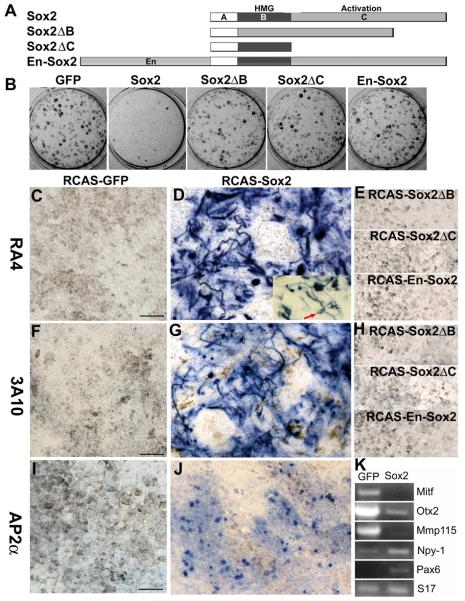
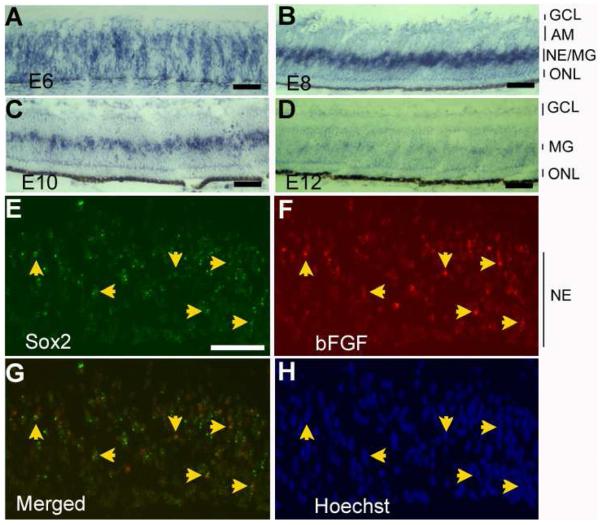
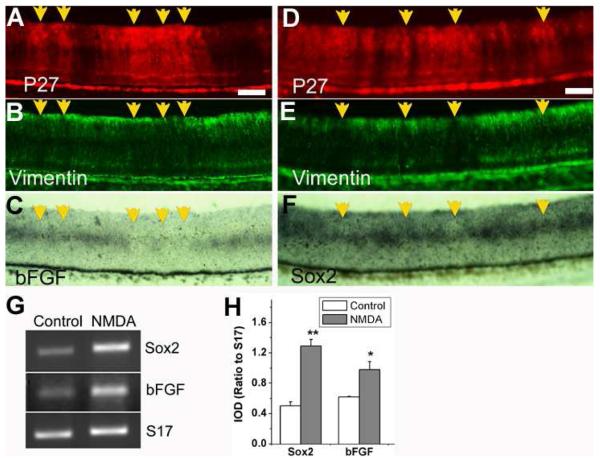
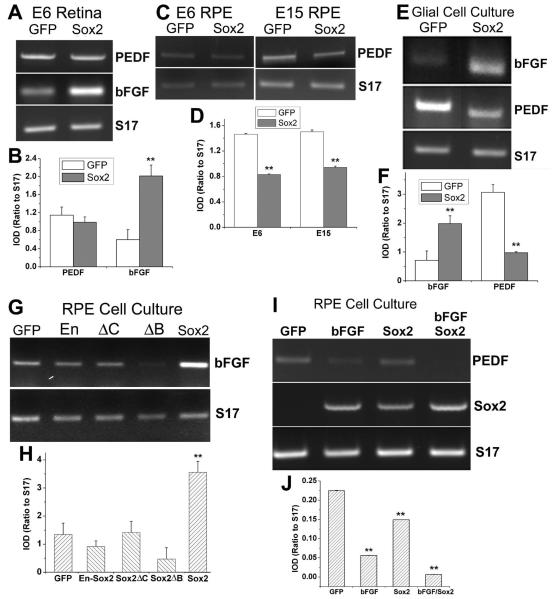
Guiding non-neural, retinal pigment epithelium (RPE) to produce retinal neurons may offer a source of developing neurons for cell-replacement. Sox2 plays important roles in maintaining neural progenitor/stem cell properties and in converting fibroblasts into pluripotent stem cells. This study tests the possibility of using Sox2 to reprogram RPE to differentiate toward retinal neurons in vivo and in vitro. Expression of Sox2 in the chick retina was detected in progenitor cells, in cells at a discrete location in the layers of amacrine and ganglion cells, and in Muller glia. Overexpression of Sox2 in the developing eye resulted in hypopigmentation of the RPE. In the affected regions, expression of retinal ganglion cell markers became apparent in the RPE layer. In RPE cell culture, Sox2 promoted the expression of retinal ganglion and amacrine markers, and suppressed the expression of genes associated with RPE properties. Mechanistic investigation using the developing retina revealed a coexpression of Sox2 and basic fibroblast growth factor (bFGF), a growth factor commonly used in stem cell culture and capable of inducing RPE-to-retina transdifferentiation (or reprogramming) during early development. Similar patterns of changes in Sox2 expression and in bFGF expression were observed in atrophic retina and in injured retina. In RPE cell culture, Sox2 and bFGF mutually enhanced one another's expression. Upregulation of bFGF expression by Sox2 also occurred in the retina. These results suggest that Sox2 can initiate a reprogramming of RPE cells to differentiate toward retinal neurons and may engage bFGF during the process.
Figures
Similar articles
-
Reprogramming chick RPE progeny cells to differentiate towards retinal neurons by ash1.Mol Vis. 2008;14:2309-20. Epub 2008 Dec 12. Mol Vis. 2008. PMID: 19093008 Free PMC article.
-
Using neurogenin to reprogram chick RPE to produce photoreceptor-like neurons.Invest Ophthalmol Vis Sci. 2010 Jan;51(1):516-25. doi: 10.1167/iovs.09-3822. Epub 2009 Jul 23. Invest Ophthalmol Vis Sci. 2010. PMID: 19628733 Free PMC article.
-
Long-term survival and differentiation of retinal neurons derived from human embryonic stem cell lines in un-immunosuppressed mouse retina.Mol Vis. 2012;18:920-36. Epub 2012 Apr 12. Mol Vis. 2012. PMID: 22539871 Free PMC article.
-
Generating retinal neurons by reprogramming retinal pigment epithelial cells.Expert Opin Biol Ther. 2010 Aug;10(8):1227-39. doi: 10.1517/14712598.2010.495218. Expert Opin Biol Ther. 2010. PMID: 20528097 Free PMC article. Review.
-
Stem cell based therapies for age-related macular degeneration: The promises and the challenges.Prog Retin Eye Res. 2015 Sep;48:1-39. doi: 10.1016/j.preteyeres.2015.06.004. Epub 2015 Jun 23. Prog Retin Eye Res. 2015. PMID: 26113213 Review.
Cited by
-
Pigment Epithelia of the Eye: Cell-Type Conversion in Regeneration and Disease.Life (Basel). 2022 Mar 6;12(3):382. doi: 10.3390/life12030382. Life (Basel). 2022. PMID: 35330132 Free PMC article. Review.
-
Cancer cell intrinsic TIM-3 induces glioblastoma progression.iScience. 2022 Oct 10;25(11):105329. doi: 10.1016/j.isci.2022.105329. eCollection 2022 Nov 18. iScience. 2022. PMID: 36325060 Free PMC article.
-
Molecular Mechanisms Mediating Diabetic Retinal Neurodegeneration: Potential Research Avenues and Therapeutic Targets.J Mol Neurosci. 2018 Nov;66(3):445-461. doi: 10.1007/s12031-018-1188-x. Epub 2018 Oct 6. J Mol Neurosci. 2018. PMID: 30293228 Review.
-
Reprogramming human retinal pigmented epithelial cells to neurons using recombinant proteins.Stem Cells Transl Med. 2014 Dec;3(12):1526-34. doi: 10.5966/sctm.2014-0038. Epub 2014 Oct 8. Stem Cells Transl Med. 2014. PMID: 25298373 Free PMC article.
-
Deficiency of C-X-C chemokine receptor type 5 (CXCR5) gene causes dysfunction of retinal pigment epithelium cells.Lab Invest. 2021 Feb;101(2):228-244. doi: 10.1038/s41374-020-00491-4. Epub 2020 Sep 29. Lab Invest. 2021. PMID: 32994482 Free PMC article.
References
-
- Adler R. A model of retinal cell differentiation in the chick embryo. Prog Retinal Eye Res. 2000;19:529–557. - PubMed
-
- Dyer MA, Cepko CL. Regulating proliferation during retinal development. Nat Rev Neurosci. 2001;2:333–342. - PubMed
-
- Pearson BJ, Doe CQ. Specification of temporal identity in the developing nervous system. Annu Rev Cell Dev Biol. 2004;20:619–647. - PubMed
-
- Zaghloul NA, Yan B, Moody SA. Step-wise specification of retinal stem cells during normal embryogenesis. Biol Cell. 2005;97:321–337. - PubMed
-
- Zhao S, Rizzolo LJ, Barnstable CJ. Differentiation and transdifferentiation of the retina pigment epithelium. Int Rev Cytol. 1997;171:225–265. - PubMed
Publication types
MeSH terms
Substances
Grants and funding
LinkOut - more resources
Full Text Sources
Other Literature Sources
