Epigallocatechin-3-gallate affects the growth of LNCaP cells via membrane fluidity and distribution of cellular zinc
- PMID: 19489106
- PMCID: PMC2689553
- DOI: 10.1631/jzus.B0820400
Epigallocatechin-3-gallate affects the growth of LNCaP cells via membrane fluidity and distribution of cellular zinc
Abstract
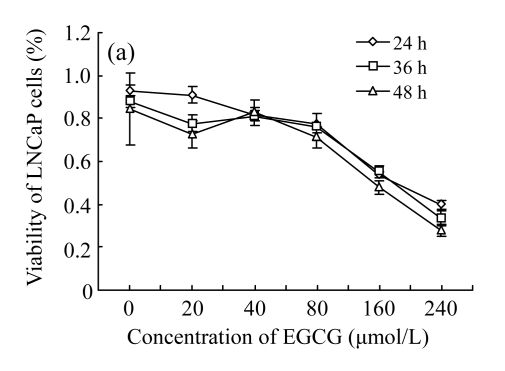
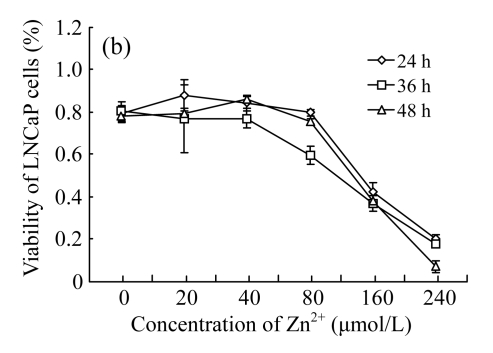
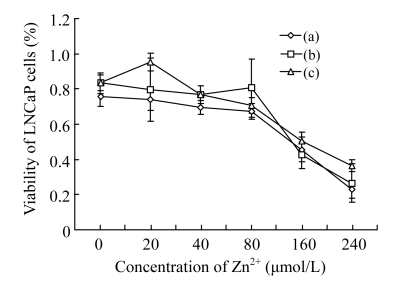
Objective: To evaluate effects of epigallocatechin-3-gallate (EGCG) on the viability, membrane properties, and zinc distribution, with and without the presence of Zn(2+), in human prostate carcinoma LNCaP cells.
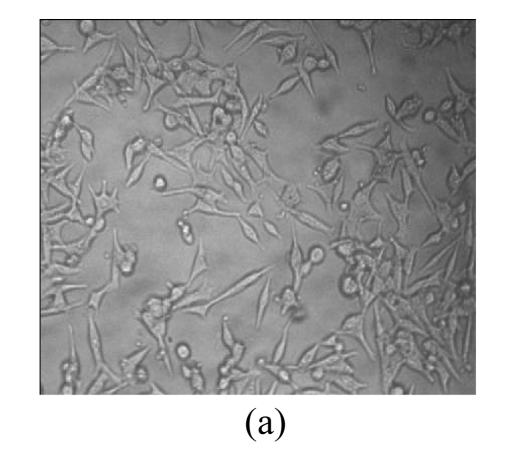
Methods: We examined changes in cellular morphology and membrane fluidity of LNCaP cells, distribution of cellular zinc, and the incorporated portion of EGCG after treatments with EGCG, Zn(2+), and EGCG+Zn(2+).
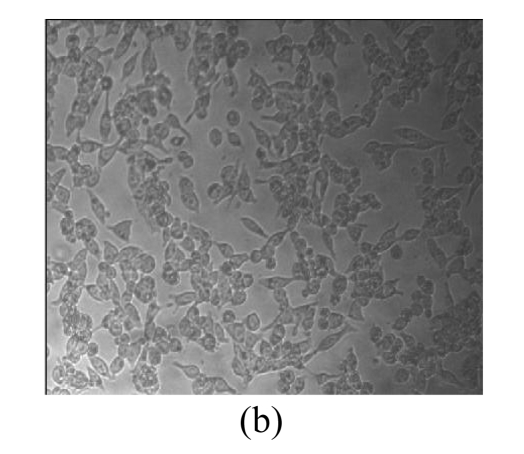
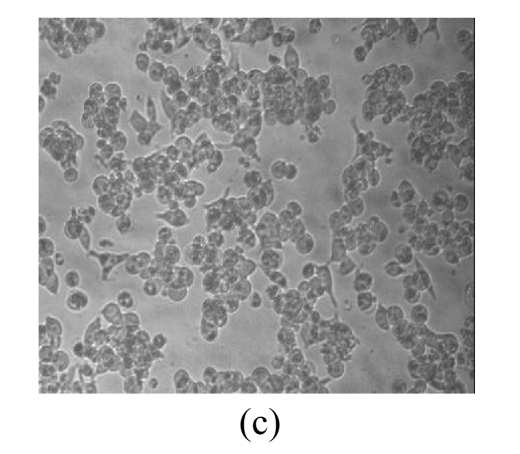
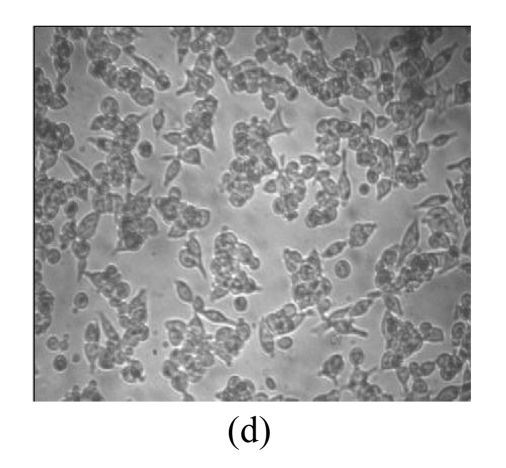
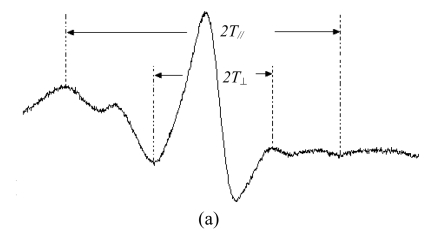
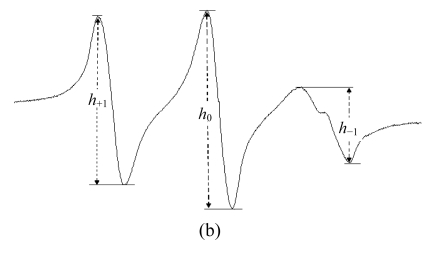
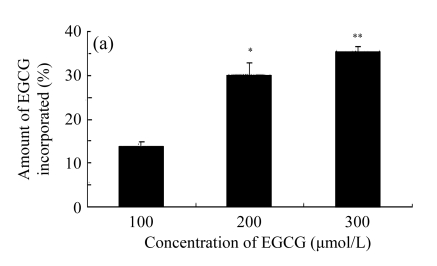
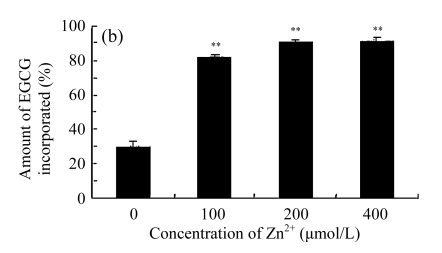
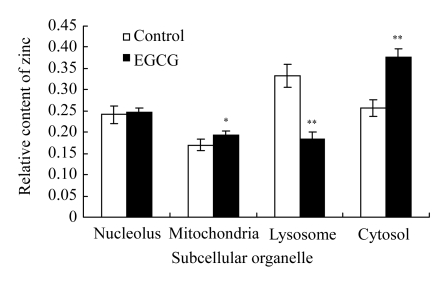
Results: We observed an alteration in cellular morphology and a decrease in membrane fluidity of LNCaP cells after treatment with EGCG or Zn(2+). The proportion of EGCG incorporated into liposomes treated with the mixture of EGCG and Zn(2+) at the ratio of 1:1 was 90.57%, which was significantly higher than that treated with EGCG alone (30.33%). Electron spin resonance (ESR) studies and determination of fatty acids showed that the effects of EGCG on the membrane fluidity of LNCaP were decreased by Zn(2+). EGCG accelerated the accumulation of zinc in the mitochondria and cytosol as observed by atomic absorption spectrometer.
Conclusion: These results show that EGCG interacted with cell membrane, decreased the membrane fluidity of LNCaP cells, and accelerated zinc accumulation in the mitochondria and cytosol, which could be the mechanism by which EGCG inhibits proliferation of LNCaP cells. In addition, high concentrations of Zn(2+) could attenuate the actions elicited by EGCG.
Figures
Similar articles
-
Mechanism of free Zn(2+) enhancing inhibitory effects of EGCG on the growth of PC-3 cells: interactions with mitochondria.Biol Trace Elem Res. 2009 Dec;131(3):298-310. doi: 10.1007/s12011-009-8362-5. Epub 2009 Mar 27. Biol Trace Elem Res. 2009. PMID: 19326061
-
Cytotoxicity of epigallocatechin-3-gallate to LNCaP cells in the presence of Cu2+.J Zhejiang Univ Sci B. 2005 Feb;6(2):125-31. doi: 10.1631/jzus.2005.B0125. J Zhejiang Univ Sci B. 2005. PMID: 15633248 Free PMC article.
-
Effects of interactions of EGCG and Cd(2+) on the growth of PC-3 cells and their mechanisms.Food Chem Toxicol. 2007 Feb;45(2):244-9. doi: 10.1016/j.fct.2006.08.015. Epub 2006 Aug 30. Food Chem Toxicol. 2007. PMID: 17046135
-
Free Zn(2+) enhances inhibitory effects of EGCG on the growth of PC-3 cells.Mol Nutr Food Res. 2008 Apr;52(4):465-71. doi: 10.1002/mnfr.200700172. Mol Nutr Food Res. 2008. PMID: 18324707
-
Role of Zn2+ in epigallocatechin gallate affecting the growth of PC-3 cells.J Trace Elem Med Biol. 2007;21(2):125-31. doi: 10.1016/j.jtemb.2006.12.007. Epub 2007 Mar 27. J Trace Elem Med Biol. 2007. PMID: 17499153
Cited by
-
Effect of bioactive dietary polyphenols on zinc transport across the intestinal Caco-2 cell monolayers.J Agric Food Chem. 2011 Apr 27;59(8):3606-12. doi: 10.1021/jf104260j. Epub 2011 Mar 16. J Agric Food Chem. 2011. PMID: 21410257 Free PMC article.
-
Green Tea Catechins for Prostate Cancer Prevention: Present Achievements and Future Challenges.Antioxidants (Basel). 2017 Apr 5;6(2):26. doi: 10.3390/antiox6020026. Antioxidants (Basel). 2017. PMID: 28379200 Free PMC article. Review.
-
Essential Elements and Isoflavonoids in the Prevention of Prostate Cancer.Nutrients. 2022 Mar 14;14(6):1225. doi: 10.3390/nu14061225. Nutrients. 2022. PMID: 35334882 Free PMC article.
-
Antioxidant Metabolism Pathways in Vitamins, Polyphenols, and Selenium: Parallels and Divergences.Int J Mol Sci. 2024 Feb 23;25(5):2600. doi: 10.3390/ijms25052600. Int J Mol Sci. 2024. PMID: 38473850 Free PMC article. Review.
-
Membrane Aging as the Real Culprit of Alzheimer's Disease: Modification of a Hypothesis.Neurosci Bull. 2018 Apr;34(2):369-381. doi: 10.1007/s12264-017-0192-4. Epub 2017 Nov 24. Neurosci Bull. 2018. PMID: 29177767 Free PMC article. Review.
References
-
- Bettuzzi S, Brausi M, Rizzi F, Castagnetti G, Peracchia G, Corti A. Chemoprevention of human prostate cancer by oral administration of green tea catechins in volunteers with high-grade prostate intraepithelial neoplasia: a preliminary report from a one-year proof-of-principle study. Cancer Res. 2006;66(2):1234–1240. doi: 10.1158/0008-5472.CAN-05-1145. - DOI - PubMed
Publication types
MeSH terms
Substances
LinkOut - more resources
Full Text Sources
Other Literature Sources
Medical
Miscellaneous