

Dual spatial maps of transcript and protein abundance in the mouse brain
- PMID: 19489697
- PMCID: PMC2744401
- DOI: 10.1586/epr.09.46
Dual spatial maps of transcript and protein abundance in the mouse brain
Abstract
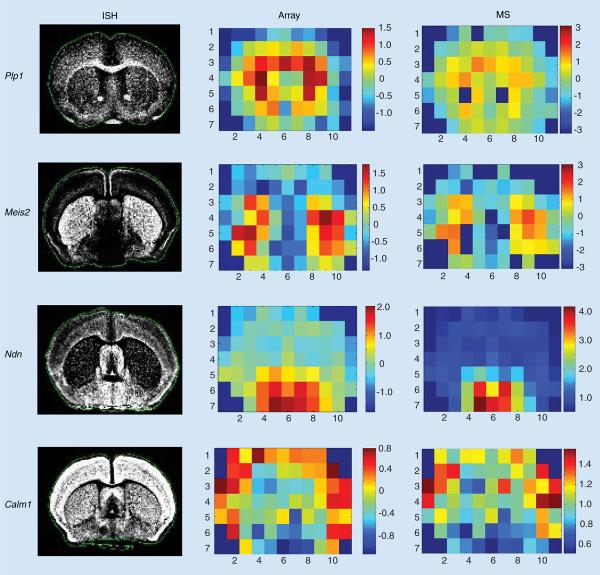
Integrating quantitative proteomic and transcriptomic datasets promises valuable insights in unraveling the molecular mechanisms of the brain. We concentrate on recent studies using mass spectrometry and microarray data to investigate transcript and protein abundance in normal and diseased neural tissues. Highlighted are dual spatial maps of these molecules obtained using voxelation of the mouse brain. We demonstrate that the relationship between transcript and protein levels displays a specific anatomical distribution, with greatest fidelity in midline structures and the hypothalamus. Genes are also identified that have strong correlations between mRNA and protein abundance. In addition, transcriptomic and proteomic analysis of mouse models of Parkinson's disease are discussed.
Figures
Similar articles
-
Investigation of different transcript quantitation tools for high-throughput mapping of brain gene expression using voxelation.J Mol Histol. 2004 May;35(4):397-402. doi: 10.1023/b:hijo.0000039878.01844.c6. J Mol Histol. 2004. PMID: 15503813
-
Mapping protein abundance patterns in the brain using voxelation combined with liquid chromatography and mass spectrometry.Methods. 2010 Feb;50(2):77-84. doi: 10.1016/j.ymeth.2009.07.009. Epub 2009 Aug 3. Methods. 2010. PMID: 19654045 Free PMC article.
-
Spatial mapping of protein abundances in the mouse brain by voxelation integrated with high-throughput liquid chromatography-mass spectrometry.Genome Res. 2007 Mar;17(3):328-36. doi: 10.1101/gr.5799207. Epub 2007 Jan 25. Genome Res. 2007. PMID: 17255552 Free PMC article.
-
Insights into the regulation of protein abundance from proteomic and transcriptomic analyses.Nat Rev Genet. 2012 Mar 13;13(4):227-32. doi: 10.1038/nrg3185. Nat Rev Genet. 2012. PMID: 22411467 Free PMC article. Review.
-
On the Dependency of Cellular Protein Levels on mRNA Abundance.Cell. 2016 Apr 21;165(3):535-50. doi: 10.1016/j.cell.2016.03.014. Cell. 2016. PMID: 27104977 Review.
Cited by
-
Interleukin-6 expression under gravitational stress due to vibration and hypergravity in follicular thyroid cancer cells.PLoS One. 2013 Jul 2;8(7):e68140. doi: 10.1371/journal.pone.0068140. Print 2013. PLoS One. 2013. PMID: 23844163 Free PMC article.
-
Differential maturation of vesicular glutamate and GABA transporter expression in the mouse auditory forebrain during the first weeks of hearing.Brain Struct Funct. 2016 Jun;221(5):2619-73. doi: 10.1007/s00429-015-1062-3. Epub 2015 Jul 10. Brain Struct Funct. 2016. PMID: 26159773 Free PMC article.
-
Mapping Molecular Datasets Back to the Brain Regions They are Extracted from: Remembering the Native Countries of Hypothalamic Expatriates and Refugees.Adv Neurobiol. 2018;21:101-193. doi: 10.1007/978-3-319-94593-4_6. Adv Neurobiol. 2018. PMID: 30334222 Free PMC article.
References
-
- Lein ES, Hawrylycz MJ, Ao N, et al. Genome-wide atlas of gene expression in the adult mouse brain. Nature. 2007;445(7124):168–176. - PubMed
-
- Gong S, Zheng C, Doughty ML, et al. A gene expression atlas of the central nervous system based on bacterial artificial chromosomes. Nature. 2003;425(6961):917–925. - PubMed
-
Complete in situ hybridization atlas of all genes in the mouse brain.
-
- Meng F, Forbes AJ, Miller LM, Kelleher NL. Detection and localization of protein modifications by high resolution tandem mass spectrometry. Mass Spectrom. Rev. 2005;24(2):126–134. - PubMed
-
- Stoeckli M, Chaurand P, Hallahan DE, Caprioli RM. Imaging mass spectrometry: a new technology for the analysis of protein expression in mammalian tissues. Nat. Med. 2001;7(4):493–496. - PubMed
-
Use of MALDI to create 2D protein‑abundance maps from brainsections.
-
- Schwartz SA, Weil RJ, Thompson RC, et al. Proteomic-based prognosis of brain tumor patients using direct-tissue matrix-assisted laser desorption ionization mass spectrometry. Cancer Res. 2005;65(17):7674–7681. - PubMed
Publication types
MeSH terms
Substances
Grants and funding
LinkOut - more resources
Full Text Sources