

Impaired glucose transporter-1 degradation and increased glucose transport and oxidative stress in response to high glucose in chondrocytes from osteoarthritic versus normal human cartilage
- PMID: 19490621
- PMCID: PMC2714130
- DOI: 10.1186/ar2713
Impaired glucose transporter-1 degradation and increased glucose transport and oxidative stress in response to high glucose in chondrocytes from osteoarthritic versus normal human cartilage
Abstract
Introduction: Disorders that affect glucose metabolism, namely diabetes mellitus (DM), may favor the development and/or progression of osteoarthritis (OA). Thus far, little is known regarding the ability of chondrocytes to adjust to variations in the extracellular glucose concentration, resulting from hypoglycemia and hyperglycemia episodes, and so, to avoid deleterious effects resulting from deprivation or intracellular accumulation of glucose. The aim of this study was to compare the ability of normal and OA chondrocytes to regulate their glucose transport capacity in conditions of insufficient or excessive extracellular glucose and to identify the mechanisms involved and eventual deleterious consequences, namely the production of reactive oxygen species (ROS).
Methods: Chondrocytes, isolated from normal and OA human cartilage, were maintained in high-density monolayer cultures, in media without or with 10 or 30 mM glucose. Glucose transport was measured as the uptake of 2-deoxy-D-glucose (2-DG). Glucose transporter-1 (GLUT-1) mRNA and protein content were evaluated by real-time RT-PCR and western blot, respectively. ROS production was measured with 2',7'-dichlorodihydrofluorescein diacetate.
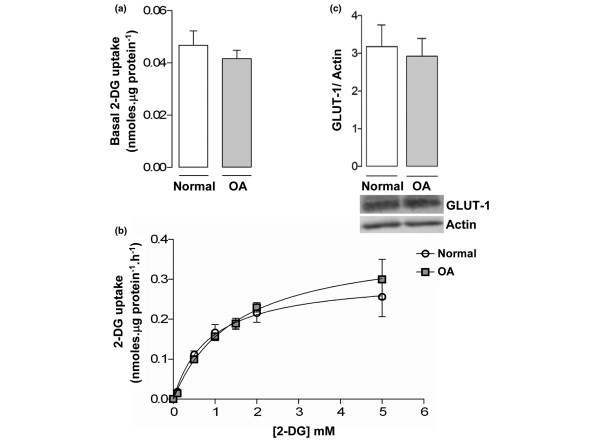
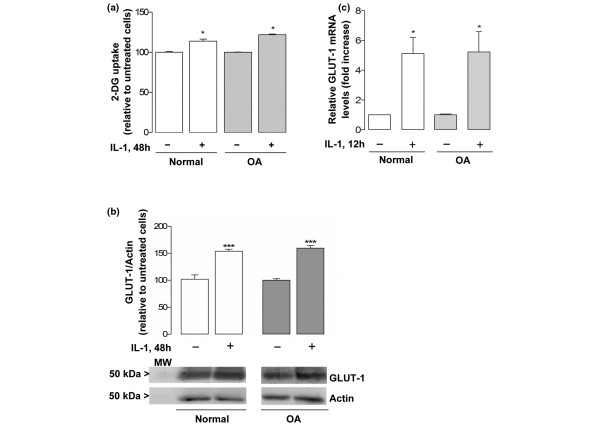
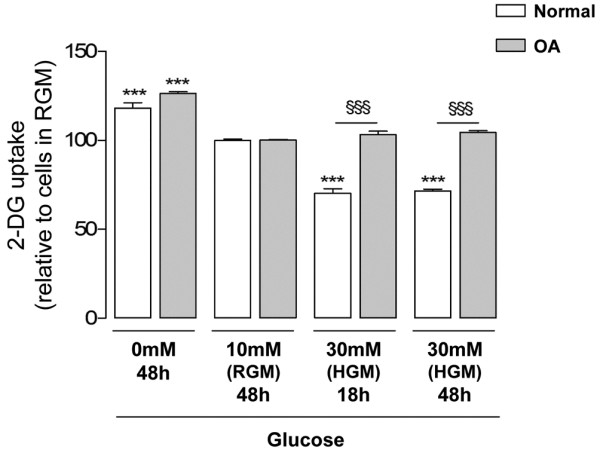
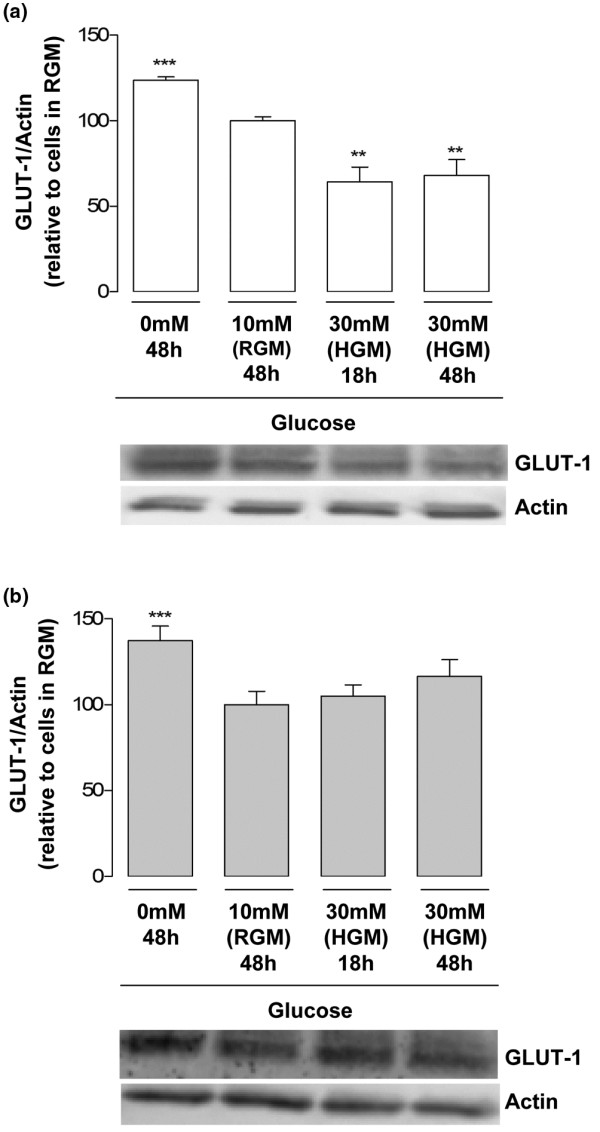
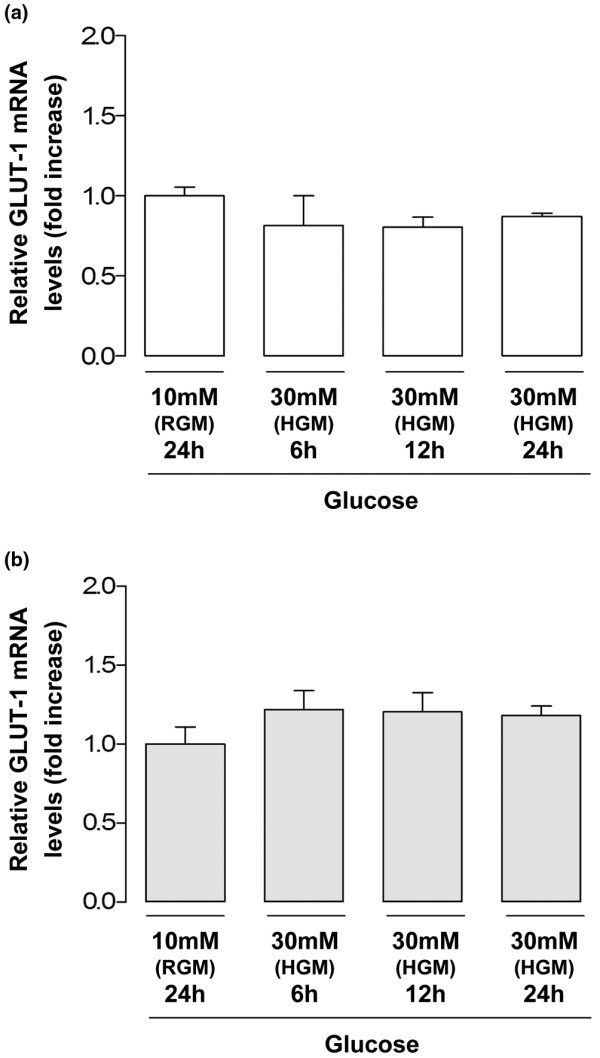
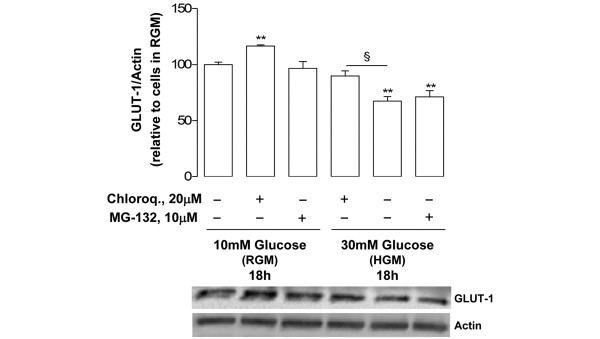
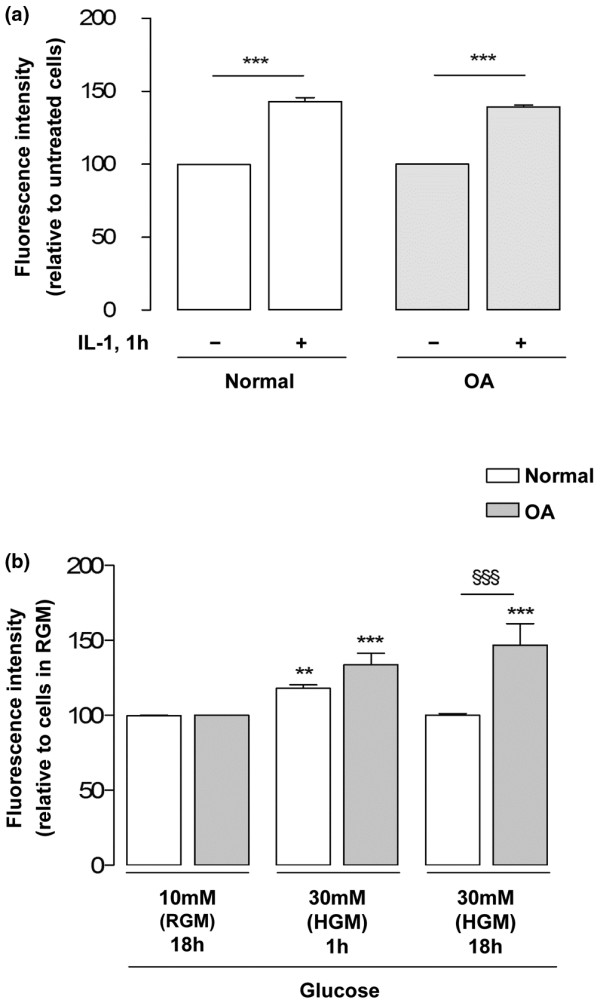
Results: Basal and IL-1beta-induced 2-DG uptake, including the affinity (1.066 +/- 0.284 and 1.49 +/- 0.59 mM) and maximal velocity (0.27 +/- 0.08 and 0.33 +/- 0.08 nmol/microg protein/hour), and GLUT-1 content were identical in normal and OA chondrocytes. Glucose deprivation increased 2-DG uptake and GLUT-1 protein both in normal and OA chondrocytes. Exposure to high glucose (30 mM) for 18 or 48 hours decreased those parameters in normal but not in OA chondrocytes. GLUT-1 mRNA levels were unaffected by high glucose, either in normal or OA chondrocytes. The high glucose-induced reduction in GLUT-1 protein in normal chondrocytes was reversed by treatment with a lysosome inhibitor. High glucose induced ROS production, which lasted significantly longer in OA than in normal chondrocytes.
Conclusions: Normal human chondrocytes adjust to variations in the extracellular glucose concentration by modulating GLUT-1 synthesis and degradation which involves the lysosome pathway. Although capable of adjusting to glucose deprivation, OA chondrocytes exposed to high glucose were unable downregulate GLUT-1, accumulating more glucose and producing more ROS. Impaired GLUT-1 downregulation may constitute an important pathogenic mechanism by which conditions characterized by hyperglycemia, like DM, can promote degenerative changes in chondrocytes that can facilitate the progression of OA.
Figures
Similar articles
-
Expression and function of the insulin receptor in normal and osteoarthritic human chondrocytes: modulation of anabolic gene expression, glucose transport and GLUT-1 content by insulin.Osteoarthritis Cartilage. 2011 Jun;19(6):719-27. doi: 10.1016/j.joca.2011.02.004. Epub 2011 Feb 13. Osteoarthritis Cartilage. 2011. PMID: 21324373
-
Elevated glucose promotes MMP13 and ADAMTS5 production by osteoarthritic chondrocytes under oxygenated but not hypoxic conditions.J Cell Physiol. 2024 Jun;239(6):e31271. doi: 10.1002/jcp.31271. Epub 2024 Apr 9. J Cell Physiol. 2024. PMID: 38595042
-
Expression and function of K(ATP) channels in normal and osteoarthritic human chondrocytes: possible role in glucose sensing.J Cell Biochem. 2013 Aug;114(8):1879-89. doi: 10.1002/jcb.24532. J Cell Biochem. 2013. PMID: 23494827 Free PMC article. Clinical Trial.
-
Glucose transport and metabolism in chondrocytes: a key to understanding chondrogenesis, skeletal development and cartilage degradation in osteoarthritis.Histol Histopathol. 2002 Oct;17(4):1239-67. doi: 10.14670/HH-17.1239. Histol Histopathol. 2002. PMID: 12371151 Review.
-
Molecular regulation of articular chondrocyte function and its significance in osteoarthritis.Histol Histopathol. 2011 Mar;26(3):377-94. doi: 10.14670/HH-26.377. Histol Histopathol. 2011. PMID: 21210351 Review.
Cited by
-
Application for proteomic techniques in studying osteoarthritis: a review.Front Physiol. 2011 Dec 2;2:90. doi: 10.3389/fphys.2011.00090. eCollection 2011. Front Physiol. 2011. PMID: 22144964 Free PMC article.
-
Impact of diabetes mellitus on osteoarthritis: a scoping review on biomarkers.Expert Rev Mol Med. 2024 Apr 12;26:e8. doi: 10.1017/erm.2024.7. Expert Rev Mol Med. 2024. PMID: 38606593 Free PMC article.
-
Autophagy and apoptosis: regulatory factors of chondrocyte phenotype transition in osteoarthritis.Hum Cell. 2023 Jul;36(4):1326-1335. doi: 10.1007/s13577-023-00926-2. Epub 2023 Jun 5. Hum Cell. 2023. PMID: 37277675 Review.
-
Identification and validation of up-regulated TNFAIP6 in osteoarthritis with type 2 diabetes mellitus.Sci Rep. 2024 Dec 28;14(1):31450. doi: 10.1038/s41598-024-82985-5. Sci Rep. 2024. PMID: 39733138 Free PMC article.
-
Glucagon-like peptide-1 receptor agonists therapy to attenuate the risk of knee osteoarthritis and total knee replacement in type 2 diabetes mellitus: A nation-wide population-based cohort study.Medicine (Baltimore). 2025 Feb 7;104(6):e41243. doi: 10.1097/MD.0000000000041243. Medicine (Baltimore). 2025. PMID: 39928811 Free PMC article.
References
-
- Goldring MB. Update on the biology of the chondrocyte and new approaches to treating cartilage diseases. Best Pract Res Clin Rheumatol. 2006;20:1003–1025. - PubMed
-
- Buckwalter JA, Martin JA. Osteoarthritis. Adv Drug Deliv Rev. 2006;58:150–167. - PubMed
-
- Hart DJ, Doyle DV, Spector TD. Association between metabolic factors and knee osteoarthritis in women: the Chingford Study. J Rheumatol. 1995;22:1118–1123. - PubMed
-
- Del Rosso A, Cerinic MM, De Giorgio F, Minari C, Rotella CM, Seghier G. Rheumatological manifestations in diabetes mellitus. Curr Diabetes Rev. 2006;2:455–466. - PubMed
-
- Sturmer T, Brenner H, Brenner RE, Gunther KP. Non-insulin dependent diabetes mellitus (NIDDM) and patterns of osteoarthritis. The Ulm osteoarthritis study. Scand J Rheumatol. 2001;30:169–171. - PubMed
Publication types
MeSH terms
Substances
LinkOut - more resources
Full Text Sources
Medical
Miscellaneous
