

The N-glycome of human embryonic stem cells
- PMID: 19490625
- PMCID: PMC2696424
- DOI: 10.1186/1471-2121-10-42
The N-glycome of human embryonic stem cells
Abstract
Background: Complex carbohydrate structures, glycans, are essential components of glycoproteins, glycolipids, and proteoglycans. While individual glycan structures including the SSEA and Tra antigens are already used to define undifferentiated human embryonic stem cells (hESC), the whole spectrum of stem cell glycans has remained unknown. We undertook a global study of the asparagine-linked glycoprotein glycans (N-glycans) of hESC and their differentiated progeny using MALDI-TOF mass spectrometric and NMR spectroscopic profiling. Structural analyses were performed by specific glycosidase enzymes and mass spectrometric fragmentation analyses.
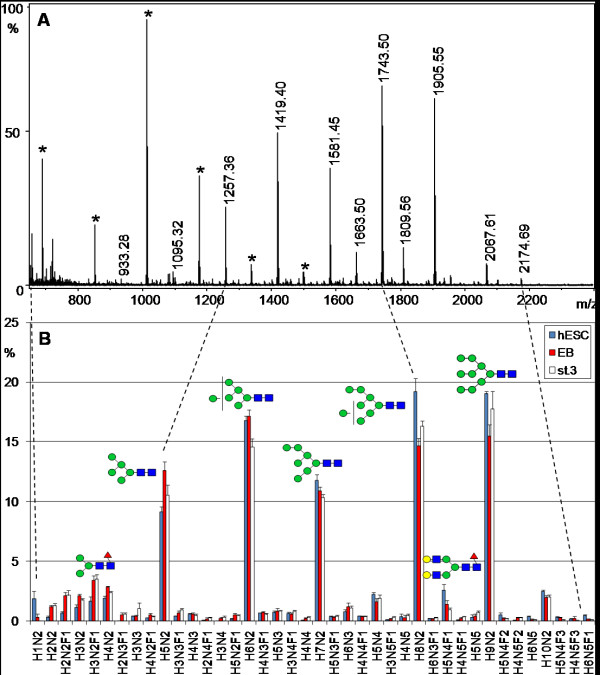
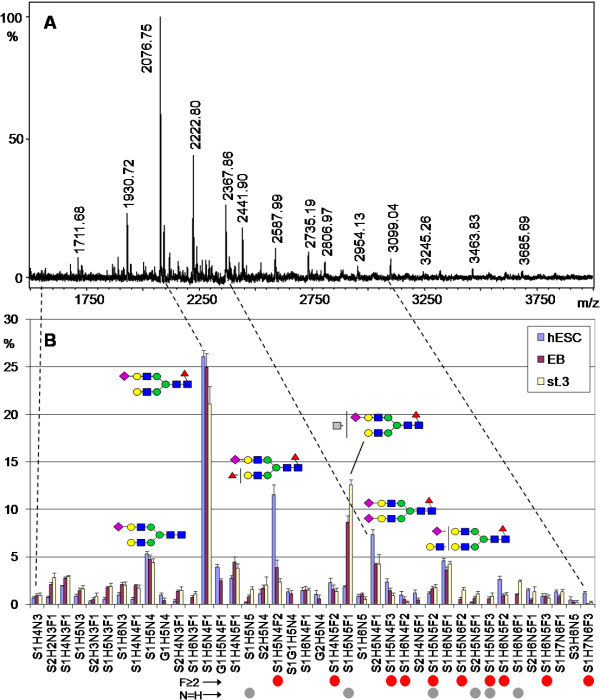
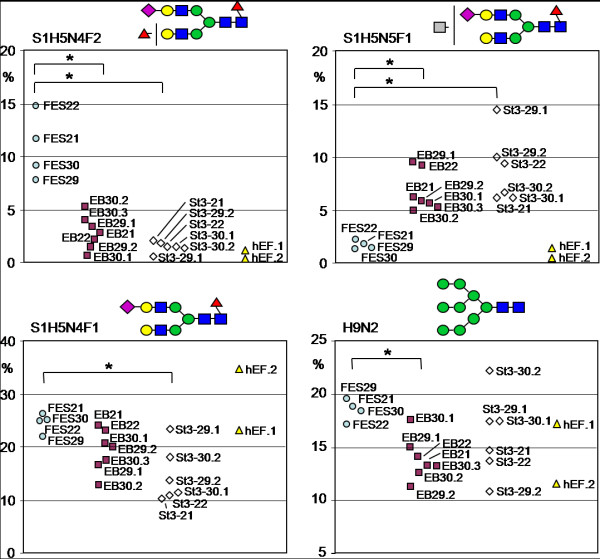
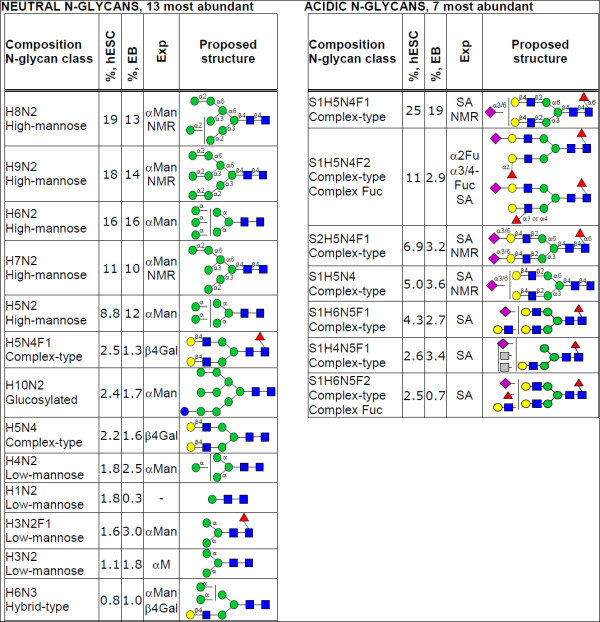
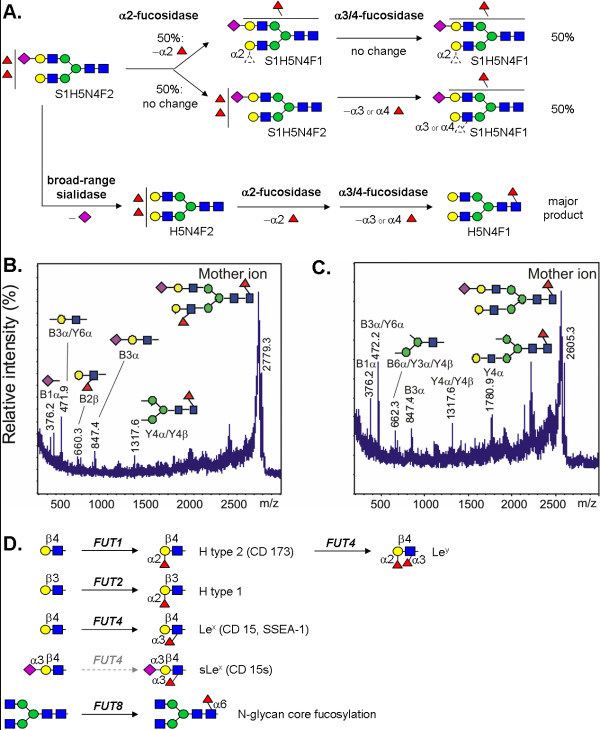
Results: The data demonstrated that hESC have a characteristic N-glycome which consists of both a constant part and a variable part that changes during hESC differentiation. hESC-associated N-glycans were downregulated and new structures emerged in the differentiated cells. Previously mouse embryonic stem cells have been associated with complex fucosylation by use of SSEA-1 antibody. In the present study we found that complex fucosylation was the most characteristic glycosylation feature also in undifferentiated hESC. The most abundant complex fucosylated structures were Lex and H type 2 antennae in sialylated complex-type N-glycans.
Conclusion: The N-glycan phenotype of hESC was shown to reflect their differentiation stage. During differentiation, hESC-associated N-glycan features were replaced by differentiated cell-associated structures. The results indicated that hESC differentiation stage can be determined by direct analysis of the N-glycan profile. These results provide the first overview of the N-glycan profile of hESC and form the basis for future strategies to target stem cell glycans.
Figures
Similar articles
-
Glycomic Analysis of Life Stages of the Human Parasite Schistosoma mansoni Reveals Developmental Expression Profiles of Functional and Antigenic Glycan Motifs.Mol Cell Proteomics. 2015 Jul;14(7):1750-69. doi: 10.1074/mcp.M115.048280. Epub 2015 Apr 16. Mol Cell Proteomics. 2015. PMID: 25883177 Free PMC article.
-
Unusual N-glycan structures in alpha-mannosidase II/IIx double null embryos identified by a systematic glycomics approach based on two-dimensional LC mapping and matrix-dependent selective fragmentation method in MALDI-TOF/TOF mass spectrometry.Mol Cell Proteomics. 2006 Nov;5(11):2146-57. doi: 10.1074/mcp.M600213-MCP200. Epub 2006 Aug 9. Mol Cell Proteomics. 2006. PMID: 16899540
-
Glycomics of bone marrow-derived mesenchymal stem cells can be used to evaluate their cellular differentiation stage.Glycoconj J. 2009 Apr;26(3):367-84. doi: 10.1007/s10719-008-9217-6. Epub 2008 Nov 27. Glycoconj J. 2009. PMID: 19037724
-
Glycosylation of mouse and human immune cells: insights emerging from N-glycomics analyses.Biochem Soc Trans. 2011 Oct;39(5):1334-40. doi: 10.1042/BST0391334. Biochem Soc Trans. 2011. PMID: 21936811 Review.
-
MALDI Mass Spectrometry Imaging of N-Linked Glycans in Tissues.Adv Exp Med Biol. 2018;1104:59-76. doi: 10.1007/978-981-13-2158-0_4. Adv Exp Med Biol. 2018. PMID: 30484244 Review.
Cited by
-
IgG and leukocytes: Targets of immunomodulatory α2,6 sialic acids.Cell Immunol. 2018 Nov;333:58-64. doi: 10.1016/j.cellimm.2018.03.014. Epub 2018 Mar 31. Cell Immunol. 2018. PMID: 29685495 Free PMC article. Review.
-
Extensive determination of glycan heterogeneity reveals an unusual abundance of high mannose glycans in enriched plasma membranes of human embryonic stem cells.Mol Cell Proteomics. 2012 Apr;11(4):M111.010660. doi: 10.1074/mcp.M111.010660. Epub 2011 Dec 6. Mol Cell Proteomics. 2012. PMID: 22147732 Free PMC article.
-
Glycosphingolipids of human embryonic stem cells.Glycoconj J. 2017 Dec;34(6):713-723. doi: 10.1007/s10719-016-9706-y. Epub 2016 Jun 21. Glycoconj J. 2017. PMID: 27325407 Free PMC article. Review.
-
Glycomic Profiling Highlights Increased Fucosylation in Pseudomyxoma Peritonei.Mol Cell Proteomics. 2018 Nov;17(11):2107-2118. doi: 10.1074/mcp.RA118.000615. Epub 2018 Aug 2. Mol Cell Proteomics. 2018. PMID: 30072579 Free PMC article.
-
Specific lectin biomarkers for isolation of human pluripotent stem cells identified through array-based glycomic analysis.Cell Res. 2011 Nov;21(11):1551-63. doi: 10.1038/cr.2011.148. Epub 2011 Sep 6. Cell Res. 2011. PMID: 21894191 Free PMC article.
References
Publication types
MeSH terms
Substances
LinkOut - more resources
Full Text Sources
Other Literature Sources
