

Genetic model for longitudinal studies of aging, health, and longevity and its potential application to incomplete data
- PMID: 19490866
- PMCID: PMC2691861
- DOI: 10.1016/j.jtbi.2009.01.023
Genetic model for longitudinal studies of aging, health, and longevity and its potential application to incomplete data
Abstract
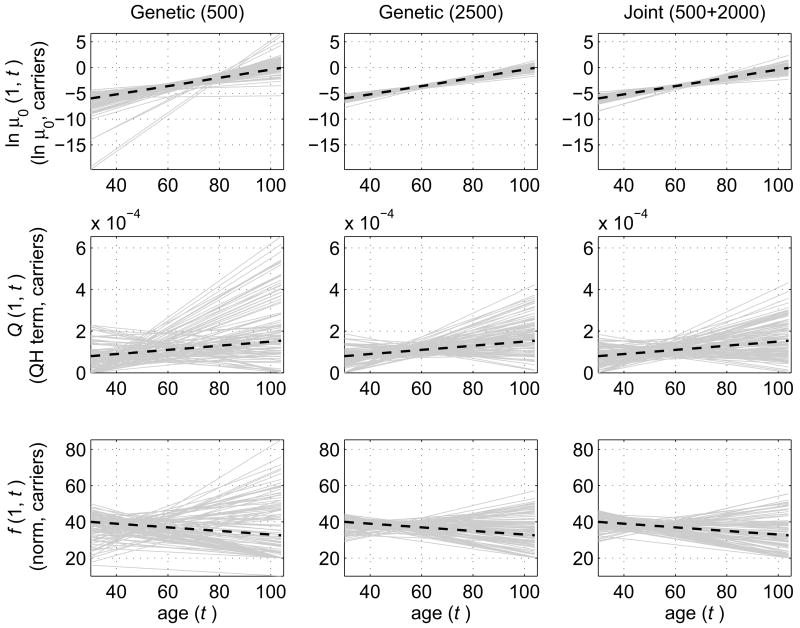
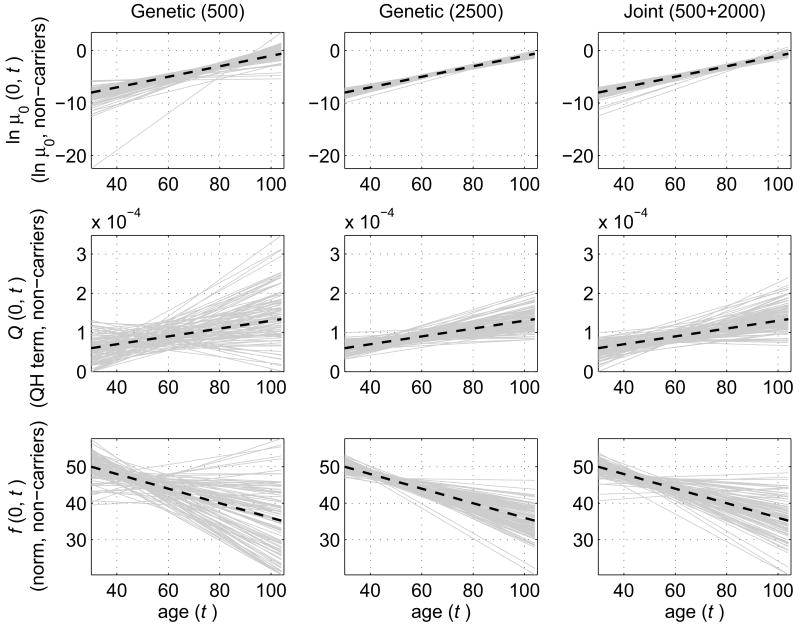
Many longitudinal studies of aging collect genetic information only for a sub-sample of participants of the study. These data also do not include recent findings, new ideas and methodological concepts developed by distinct groups of researchers. The formal statistical analyses of genetic data ignore this additional information and therefore cannot utilize the entire research potential of the data. In this paper, we present a stochastic model for studying such longitudinal data in joint analyses of genetic and non-genetic sub-samples. The model incorporates several major concepts of aging known to date and usually studied independently. These include age-specific physiological norms, allostasis and allostatic load, stochasticity, and decline in stress resistance and adaptive capacity with age. The approach allows for studying all these concepts in their mutual connection, even if respective mechanisms are not directly measured in data (which is typical for longitudinal data available to date). The model takes into account dependence of longitudinal indices and hazard rates on genetic markers and permits evaluation of all these characteristics for carriers of different alleles (genotypes) to address questions concerning genetic influence on aging-related characteristics. The method is based on extracting genetic information from the entire sample of longitudinal data consisting of genetic and non-genetic sub-samples. Thus it results in a substantial increase in the accuracy of statistical estimates of genetic parameters compared to methods that use only information from a genetic sub-sample. Such an increase is achieved without collecting additional genetic data. Simulation studies illustrate the increase in the accuracy in different scenarios for datasets structurally similar to the Framingham Heart Study. Possible applications of the model and its further generalizations are discussed.
Figures
References
-
- Allison DB, Faith MS, Heo M, Kotler DP. Hypothesis concerning the U-shaped relation between body mass index and mortality. Am J Epidemiol. 1997;146:339–349. - PubMed
-
- Boutitie F, Gueyffier F, Pocock S, Fagard R, Boissel JP. J-shaped relationship between blood pressure and mortality in hypertensive patients: New insights from a meta-analysis of individual-patient data. Ann Intern Med. 2002;136:438–448. - PubMed
-
- Breslow NE, Cain KC. Logistic regression for two-stage case-control data. Biometrika. 1988;75:11–20.
-
- Breslow NE, Holubkov R. Weighted likelihood, pseudo-likelihood and maximum likelihood methods for logistic regression analysis of two-stage data. Stat Med. 1997a;16:103–116. - PubMed
-
- Breslow NE, Holubkov R. Maximum likelihood estimation of logistic regression parameters under two-phase, outcome-dependent sampling. J Royal Stat Soc B. 1997b;59:447–461.
Publication types
MeSH terms
Grants and funding
LinkOut - more resources
Full Text Sources
Medical
