. 2009 Jun;9(6):499-511.
doi: 10.1016/j.cmet.2009.04.010.

mTERF2 regulates oxidative phosphorylation by modulating mtDNA transcription

Affiliations

mTERF2 regulates oxidative phosphorylation by modulating mtDNA transcription

Tina Wenz et al. Cell Metab. 2009 Jun.

Retraction in

Abstract

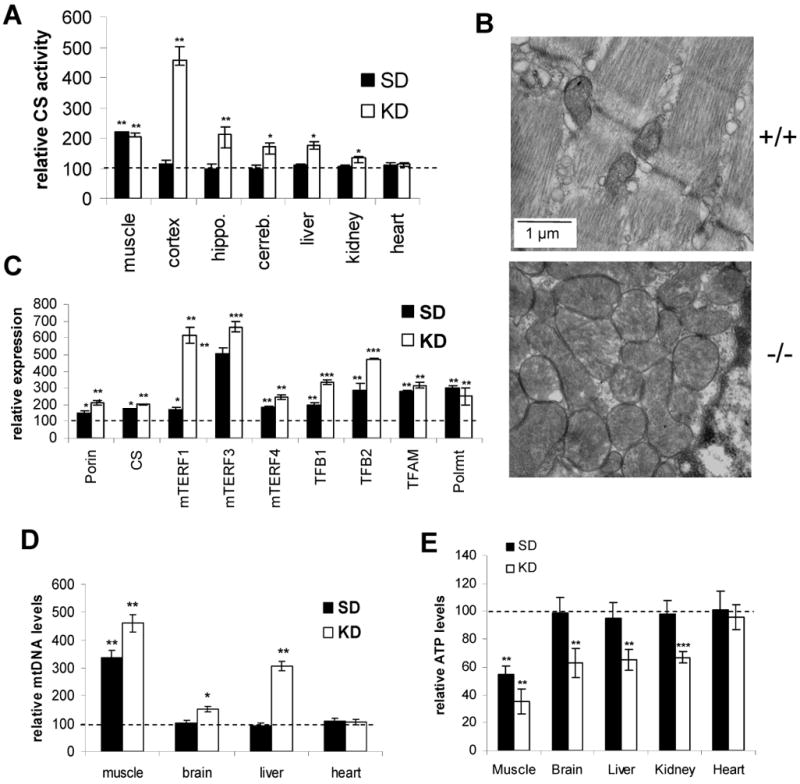
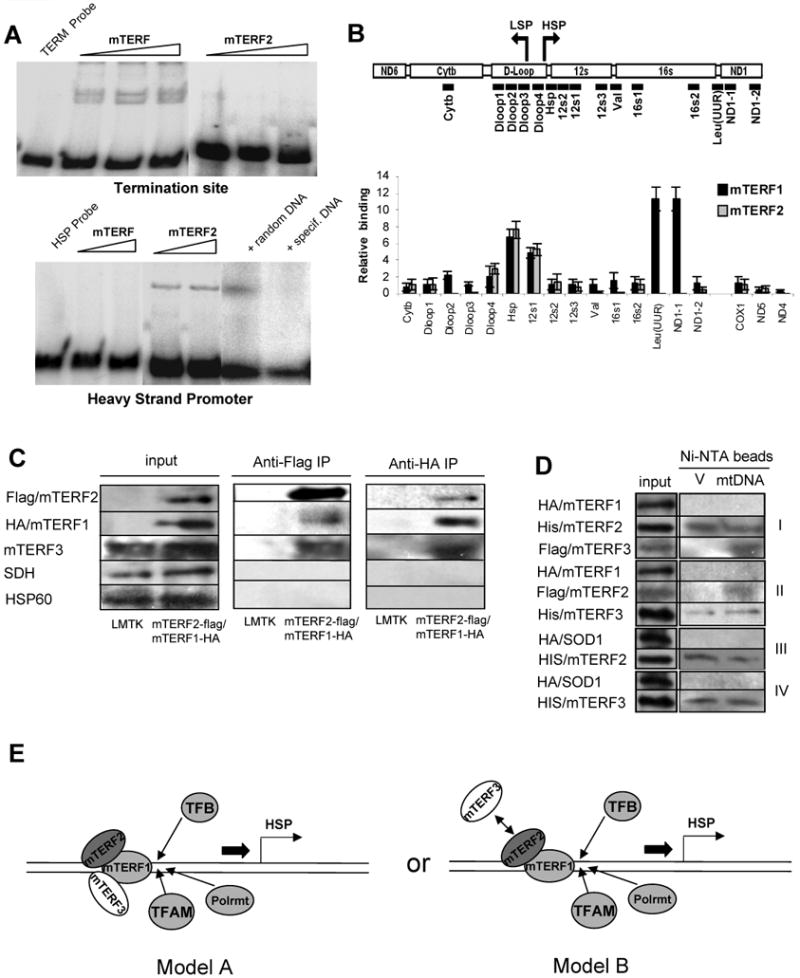
Regulation of mitochondrial protein expression is crucial for the function of the oxidative phosphorylation (OXPHOS) system. Although the basal machinery for mitochondrial transcription is known, the regulatory mechanisms are not completely understood. Here, we characterized mTERF2, a mitochondria-localized homolog of the mitochondrial transcription termination factor mTERF1. We show that inactivation of mTERF2 in the mouse results in a myopathy and memory deficits associated with decreased levels of mitochondrial transcripts and imbalanced tRNA pool. These aberrations were associated with decreased steady-state levels of OXPHOS proteins causing a decrease in respiratory function. mTERF2 binds to the mtDNA promoter region, suggesting that it affects transcription initiation. In vitro interaction studies suggest that mtDNA mediates interactions between mTERF2 and mTERF3. Our results indicate that mTERF1, mTERF2, and mTERF3 regulate transcription by acting in the same site in the mtDNA promoter region and thereby mediate fine-tuning of mitochondrial transcription and hence OXPHOS function.


Figures

Figure 1
Figure 1. Mitochondrial DNA: Genes and Transcripts
(A) Circular human mtDNA. The D-loop harbors the L strand promoter (LSP), the H strand promoter (HSP) and the origin of H strand synthesis (OH). The major L strand origin (OL) is located in the “WANCY” cluster of tRNAs. In humans, a second H strand promoter (HSP2) is located in the tRNAPhe (F) immediately upstream of the 12S rRNA. Genes transcribed from the H strand or the L strand are labeled on the outside and inside of the circle, respectively (with modification after (Bonawitz et al., 2006)). Binding sites of mTERF1 and mTERF3 are indicated. (B) Transcription initiation complexes comprised of Polrmt, TFAM and one of the two TFB isoforms are assembled at LSP and HSP. mTERF1 bind simultaneously HSP1 and TERM resulting in looping out of the 12S and 16S rRNA (with modifications after (Martin et al., 2005)).
Figure 2
Figure 2. Expression profile and mitochondrial localization of mTERF2
(A) Northern blot analysis of mTERF2 expression in different mouse tissues. A single transcript of 1.1 kb was present in all investigated tissues. β–actin was used as loading control. (B) Confocal microscopy to determine subcellular localization of mouse mTERF2. HA-tagged mTERF2 was expressed in COS cells and stained with an anti-HA antibody (green). Mitotracker stains are shown in red. (C) Submitochondrial localization of mTERF2 in heart mitochondria. mTERF2 has a localization pattern comparable to the matrix protein HSP60 and different from the inner membrane COX IV.
Figure 3
Figure 3. mTERF2 knockout mice gain less weight than wild-type controls and show signs of a myopathy
(A) Weight gain for male and female mTERF2 knockout mice and wild-type controls (N=6 each). (B) Treadmill performance and (C) endurance test of knockout and control mice (N=6 each) at 6 months of age on a standard (SD) or a ketogenic diet (KD). (D) Spatial water maze test of knockout and control mice (N=6 each) at 6 months of age on a standard (SD) or a ketogenic diet (KD). Number of mistakes and time until finding the platform were recorded.* p<0.05; ** p<0.01; *** p<0.001.
Figure 4
Figure 4. Loss of mTERF2 causes an OXPHOS deficiency
(A and B) Growth rates of control and mTERF2 knockout fibroblasts were recorded in media supplemented with galactose (N=3 for each time point). (C and D) Cytochrome c oxidase (COX) and CI+III activity in mitochondria isolated from different tissues of 6 month old mTERF2 KO mice fed a standard (SD) or a ketogenic diet (KD). The dashed line indicates the activity of SD or KD-fed control (N=3 for each group). (E and F) Quantification of mitochondrial proteins steady-state levels in muscle mitochondria mTERF2 knockout and control mice by western blot on SD or KD (N=3 for each group). The blot shows samples from KD-fed animals. The dashed line indicates the SD or KD-fed control. (G and H) BN-immunoblotting and quantification of OXPHOS complexes of skeletal muscle mitochondria from mTERF2 knockout and control mice (N=3) on a ketogenic diet. * p<0.05; ** p<0.01; *** p<0.001.
Figure 5
Figure 5. mTERF2 deficiency is associated with increased mitochondrial biogenesis and upregulation of mTERF homologues
(A) Citrate synthase (CS) activity in homogenates of different tissue of 6 months old mTERF2 KO and control mice (N=3) on a standard (SD) or a ketogenic diet (KD). The dashed line indicates the SD or KD-fed control. (B) Electron micrograph from longitudinal sections taken from the gastrocnemius muscle from 12 months old mTERF2 KO and wild-type control mice. Scale bare: 1 μm. (C) Relative expression of mTERF1, mTERF3, mTERF4, mitochondrial RNA polymerase (POLR), transcription factor B1 (TFB1) and B2 (TFB2), mitochondrial transcription factor A (TFAM) and the mitochondrial proteins porin and citrate synthase (CS) in skeletal muscle of 6 months old mTERF2 knockout and control mice (N=3). The dashed line indicates the SD or KD-fed control. (D) Relative quantification of mitochondrial DNA (ND1) versus nuclear DNA (β-actin) by qPCR of DNA isolated from skeletal muscle of 6 months old SD- and KD fed mTERF2 knockout and control mice (N=3). Values are normalized to the wild-type control on the same diet. (E) Quantification of ATP in the different tissue of 6 months old SD- and KD fed mTERF2 knockout and control mice (N=3). Values are normalized to the wild-type control on the same diet. * p<0.05; ** p<0.01; *** p<0.001.
Figure 6
Figure 6. mTERF2 deficiency causes a decreased mitochondrial DNA transcription and an imbalance of mitochondrial tRNAs steady-state levels
(A) In vivo labeling and quantification (B) mitochondrial translation products in mTERF2 KO and wild-type fibroblasts. VDAC was used as a loading control. (C and D) Steady-state levels of mitochondrial transcripts and the nuclear encoded citrate synthase (CS) in skeletal muscle of SD- and KD-fed mTERF2 knockout and wild-type control mice (N=3). The dashed line indicates the SD or KD-fed control. (E) Steady-state levels of different mitochondrial tRNAs originating from the HSP and LSP transcripts in mTERF2 deficient and control muscle (N=3) on SD. (F) The same experiments was performed with mice fed the KD. (G) Quantification of tRNA levels in muscle of SD- and KD-fed mice. The dashed line indicates the SD or KD-fed control. * p<0.05; ** p<0.01; *** p<0.001.
Figure 7
Figure 7. mTERF2 binds specifically the promoter region of mtDNA together with mTERF1 and mTERF3
(A) Electromobility shift assays (EMSA) of recombinant mTERF1 and mTERF2 at the termination site (TERM) and promoter region of mtDNA (PROM). mTERF2 binding to the promoter fragment is challenged with unspecific and specific DNA fragments. (B) Chromatin immunoprecipitation (ChIP) analysis with a monoclonal anti-flag antibody using a stable cell lines expressing flag-tagged mTERF2 or mTERF1. The panel indicates the position of the primer pairs in the Cytb-ND1 region used for the CHIP analysis. Additionally, primer pairs in COX1, ND4 and ND5 were used. (C) In vivo co-immunoprecipitation of mTERF1-mTERF2-mTERF3 complexes from LMTK cells. Shown are western blots of the input, anti-FLAG and anti-HA antibody-mediated immunoprecipitations from untransfected LMTK cells and a stable LMTK line expressing flag-tagged mTERF2 and HA-tagged mTERF1. Input lanes and immunoprecipitations were probed with anti-FLAG and anti-HA antibody. Specificity was analyzed by probing with antibodies directed against HSP60 (mitochondrial matrix protein) and succinate dehydrogenase (SDH, mitochondrial inner membrane protein). (D) In vitro co-immunoprecipitation of recombinant mTERF1, mTERF2 and mTERF3 in presence and absence of mtDNA. Bacterial lysates expressing affinity-tagged mTERF1, mTERF2 and mTERF3 and mtDNA or an unrelated plasmid vector pcDNA3.1(V) were mixed and co-immunoprecipitated with Ni-NTA magnetic beads. The following mixture of bacterial lysate were used: I – HA-tagged mTERF1, His-tagged mTERF2 and Flag-tagged mTERF3; II - HA-tagged mTERF1, Flag-tagged mTERF2 and His-tagged mTERF3; III – His-tagged mTERF2 and HA-tagged SOD1; IV – His-tagged mTERF3 and HA-tagged SOD1. (E) Model of transcription regulation by mTERF2 and mTERF3 (A) mTERF1, mTERF2 and mTERF3 bind simultaneously or (B) mTERF1 and either mTERF2 or mTERF3 bind at HSP with mTERF2 and mTERF3 binding regulating transcription initiation.

Similar articles

Cited by

References

    1. Antonicka H, Sasarman F, Kennaway NG, Shoubridge EA. The molecular basis for tissue specificity of the oxidative phosphorylation deficiencies in patients with mutations in the mitochondrial translation factor EFG1. Hum Mol Genet. 2006;15:1835–1846. - PubMed
    1. Asin-Cayuela J, Helm M, Attardi G. A monomer-to-trimer transition of the human mitochondrial transcription termination factor (mTERF) is associated with a loss of in vitro activity. J Biol Chem. 2004;279:15670–15677. - PubMed
    1. Bonawitz ND, Clayton DA, Shadel GS. Initiation and beyond: multiple functions of the human mitochondrial transcription machinery. Mol Cell. 2006;24:813–825. - PubMed
    1. Chomyn A. In vivo labeling and analysis of human mitochondrial translation products. Methods Enzymol. 1996;264:197–211. - PubMed
    1. Daga A, Micol V, Hess D, Aebersold R, Attardi G. Molecular characterization of the transcription termination factor from human mitochondria. J Biol Chem. 1993;268:8123–8130. - PubMed

Publication types