. 2009 Sep 15;162(4):1339-50.
doi: 10.1016/j.neuroscience.2009.05.070. Epub 2009 May 30.

Magnetic resonance imaging and micro-computed tomography combined atlas of developing and adult mouse brains for stereotaxic surgery

Affiliations

Magnetic resonance imaging and micro-computed tomography combined atlas of developing and adult mouse brains for stereotaxic surgery

M Aggarwal et al. Neuroscience. .

Abstract

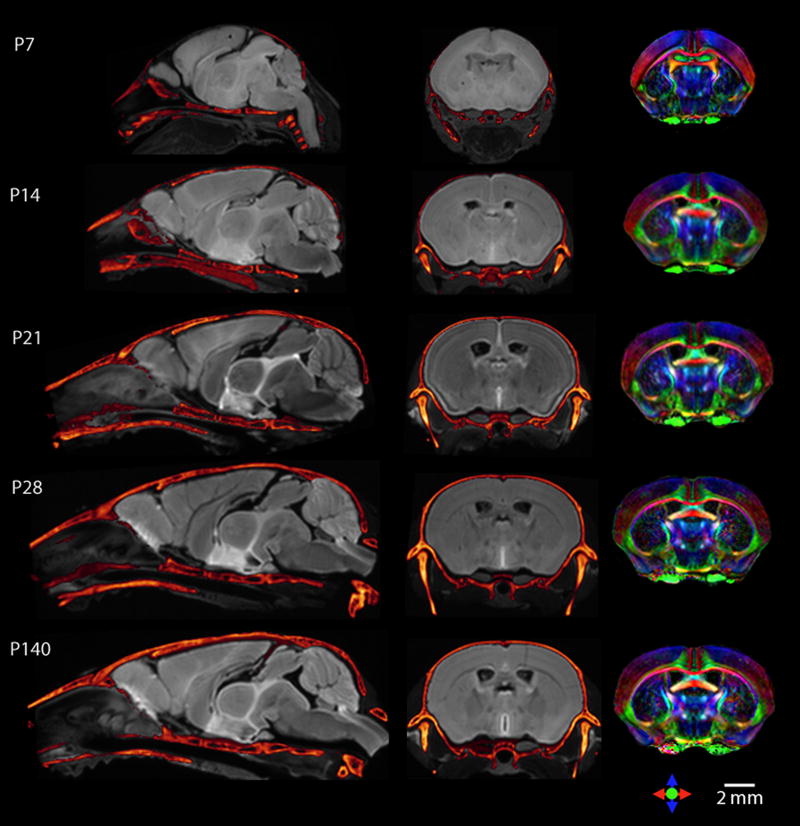
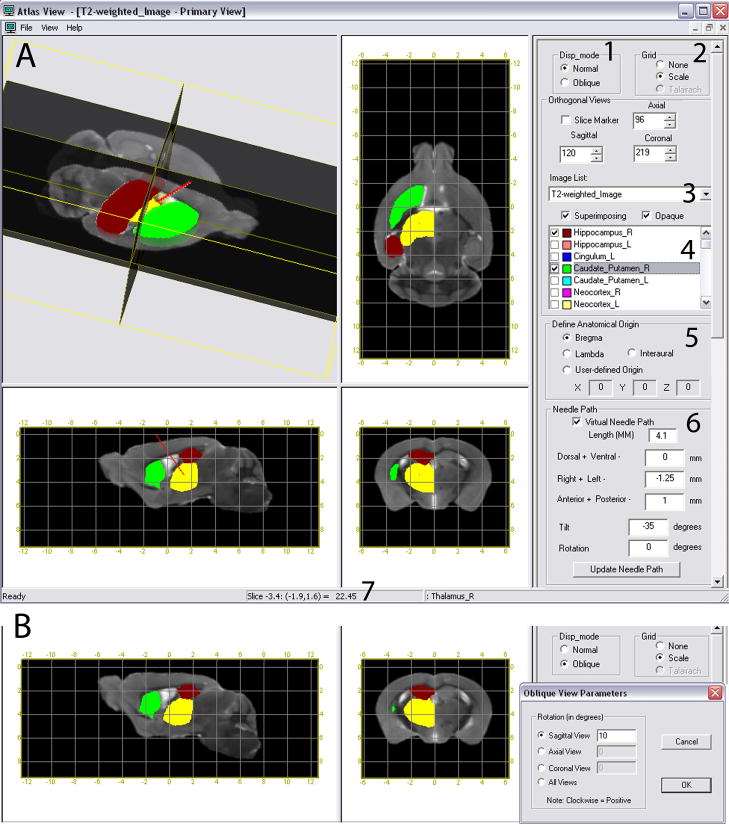
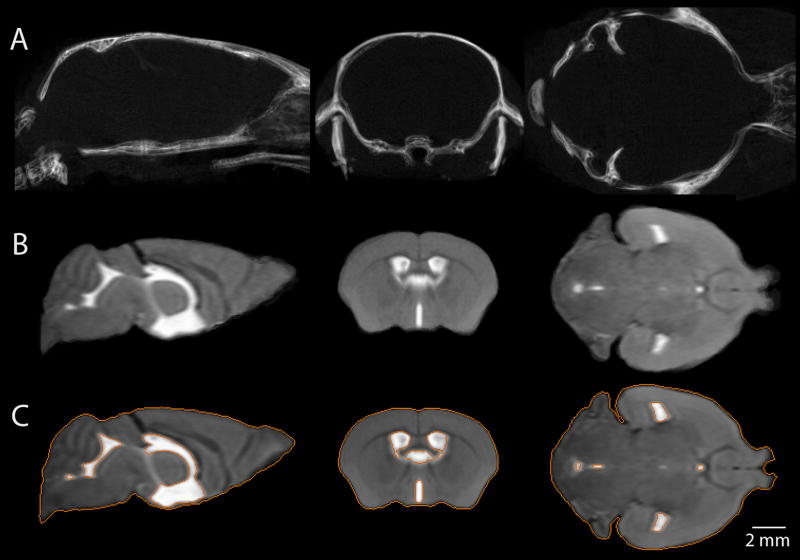
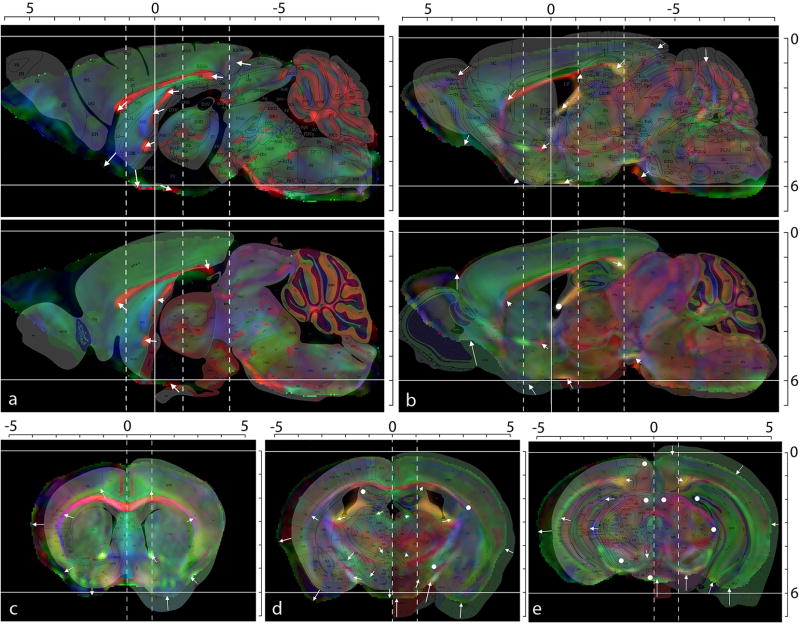
Stereotaxic atlases of the mouse brain are important in neuroscience research for targeting of specific internal brain structures during surgical operations. The effectiveness of stereotaxic surgery depends on accurate mapping of the brain structures relative to landmarks on the skull. During postnatal development in the mouse, rapid growth-related changes in the brain occur concurrently with growth of bony plates at the cranial sutures, therefore adult mouse brain atlases cannot be used to precisely guide stereotaxis in developing brains. In this study, three-dimensional stereotaxic atlases of C57BL/6J mouse brains at six postnatal developmental stages: postnatal day (P) 7, P14, P21, P28, P63 and in adults (P140-P160) were developed, using diffusion tensor imaging (DTI) and micro-computed tomography (CT). At present, most widely-used stereotaxic atlases of the mouse brain are based on histology, but the anatomical fidelity of ex vivo atlases to in vivo mouse brains has not been evaluated previously. To account for ex vivo tissue distortion due to fixation as well as individual variability in the brain, we developed a population-averaged in vivo magnetic resonance imaging adult mouse brain stereotaxic atlas, and a distortion-corrected DTI atlas was generated by nonlinearly warping ex vivo data to the population-averaged in vivo atlas. These atlas resources were developed and made available through a new software user-interface with the objective of improving the accuracy of targeting brain structures during stereotaxic surgery in developing and adult C57BL/6J mouse brains.


Figures

Figure 1
Figure 1
Three dimensional reconstruction of micro-CT images showing the dorsal view of the mouse skull at six developmental stages from P7 to P140. Cranial landmarks used to measure the skull dimensions are defined on the P140 skull image: nasion (1), bregma (2), lambda (3), intersection of the occipital and interparietal bones at the midline (4), left and right intersection of the parietal, temporal and occipital bones (5, 6).
Figure 2
Figure 2
Co-registered CT and MRI sections from single-subject C57BL/6J mouse brain images from P7 to adult. CT skull images (in metallic color) are overlaid on grey-scale average diffusion-weighted MR images of the brain. For each time point, the mid-sagittal sections are shown in the first column, and a coronal section in the second column. In the third column, the same coronal sections are shown in color-coded orientation maps derived from DTI.
Figure 3
Figure 3
User interface of the AtlasView visualization software, that enables navigation through CT and different MR contrasts in the mouse atlas with three orthogonal views, and also allows 3D rotation and extraction of oblique slices. Pre-defined anatomical structures are listed, which can be chosen for 3D and 2D visualization. In this figure, the caudoputamen (green), the thalamus (yellow), and hippocampus (red) are shown. A) 1: 3D Rotation and oblique slice extraction. 2: Grid selection for stereotaxic coordinate display. 3: CT or different MRI contrast selection. 4: Pre-defined anatomical structures. 5: Selection of coordinate origin. The origin can be specified at bregma, lambda, interaural line or a user-defined point. 6: Interface for visualization of a hypothetical needle path, by specifying the needle translation and angles of tilt and rotation. In this example, the needle (shown in red) is targeting the thalamus without hitting the hippocampus and caudoputamen. 7: Stereotaxic coordinates of any region can be read directly by moving the cursor to that location. B) Oblique slice extraction after the atlas is rotated by 10 degrees about the medial-lateral axis. The rotated brain position can be appreciated in the sagittal view and the coronal view shows a re-sliced section based on the new orientation. The new coordinates are established in the rotated brain position as shown in the grid.
Figure 4
Figure 4
The 2nd level shrinkage- and distortion-corrected atlas of the adult C57BL/6J mouse brain. (A) Population-averaged in vivo ‘master’ atlas of the C57BL/6J brain. Three orthogonal sections are shown, with contours outlining the overall brain volume and the ventricular volume. (B) The anatomical variability magnitude map (AVM) of the sections in panel A. The grey scale intensities represent distances in micrometers. (C) The distortion-corrected ex vivo atlas after warping to the in vivo master atlas. The contour lines of the in vivo atlas are overlaid on T2-weighted images of the corrected ex vivo atlas. (D) Coronal sections from the corrected ex vivo atlas, showing the color-coded orientation maps derived from DTI, with overlaid contours from the in vivo atlas.
Figure 5
Figure 5
Placement of the adult population-averaged in vivo master atlas in skull-based stereotaxic coordinates. (A) Orthogonal sections showing the averaged CT image of the adult C57BL/6J skull after rigid alignment at bregma. (B) Averaged in vivo image of the adult brain after bregma alignment. (C) Corresponding sections from the population-averaged master atlas registered to the bregma-aligned brain in panel B. The contours indicate the brain and ventricular boundaries.
Figure 6
Figure 6
Comparison of the distortion-corrected MRI-CT atlas with the existing histology-based Franklin and Paxinos and the Allen Institute (Dong, 2008) atlases for the adult C57BL/6J brain. In each panel, the color-coded orientation map derived from DTI is shown, overlaid with the closest corresponding sections from the histology-based atlases. White arrows indicate the differences in stereotaxic positions of brain structures as given by the MRI-CT and histology atlases. White circles indicate the regions with perfect alignment between the atlases. The horizontal white lines indicate the z = 0 mm (bregma-lambda line) and z = −6 mm coordinates. (a) and (b): Sagittal sections at x = 0 mm and x = 1.1 mm. The top and bottom panels show the DTI color maps overlaid with the Paxinos and the Allen Institute atlas sections respectively. (c), (d) and (e): Coronal sections at y = 1.18 mm, −1.06 mm and −2.94 mm respectively. The locations of these three coronal slices are indicated by dotted lines in (a) and (b). In each coronal section, the Franklin and Paxinos atlas slice is overlaid on the left half of the DTI section, while the Allen Institute atlas slice is overlaid on the right half for comparison. All scales are in mm units.
Figure 7
Figure 7
Changes in skull dimensions of the C57BL/6J mouse during development, from age P14 to adult (P140), from the sample population used in this study. The shaded zones indicate the 95% reliability ranges for the skull length, width, height and B-L length obtained from the adult samples.

References

    1. Alexander DC, Pierpaoli C, Basser PJ, Gee JC. Spatial transformations of diffusion tensor magnetic resonance images. IEEE Trans Med Imaging. 2001;20(11):1131–1139. - PubMed
    1. Ali AA, Dale AM, Badea A, Johnson GA. Automated segmentation of neuroanatomical structures in multispectral MR microscopy of the mouse brain. NeuroImage. 2005;27:425–435. - PubMed
    1. Allen Mouse Brain Atlas [Internet]: Allen Institute for Brain Science. http://mouse.brain-map.org.

    1. Athos J, Storm D. High precision stereotaxic surgery in mice. Current Protocols in Neuroscience Appendix. 2001;4A:1–9. - PubMed
    1. Badea A, Ali-Sharief AA, Johnson GA. Morphometric analysis of the C57BL/6J mouse brain. NeuroImage. 2007;37(3):683–693. - PMC - PubMed

Publication types