. 2009 Jul 24;284(30):19945-52.
doi: 10.1074/jbc.M109.015164. Epub 2009 Jun 2.

GCN5-mediated transcriptional control of the metabolic coactivator PGC-1beta through lysine acetylation

Affiliations

GCN5-mediated transcriptional control of the metabolic coactivator PGC-1beta through lysine acetylation

Timothy J Kelly et al. J Biol Chem. .

Abstract

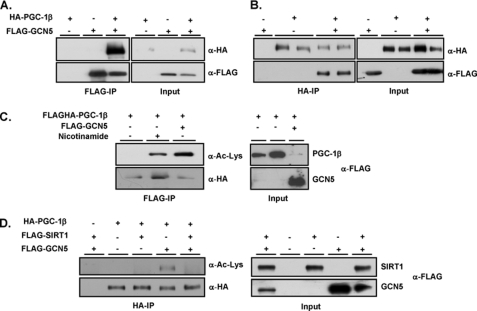
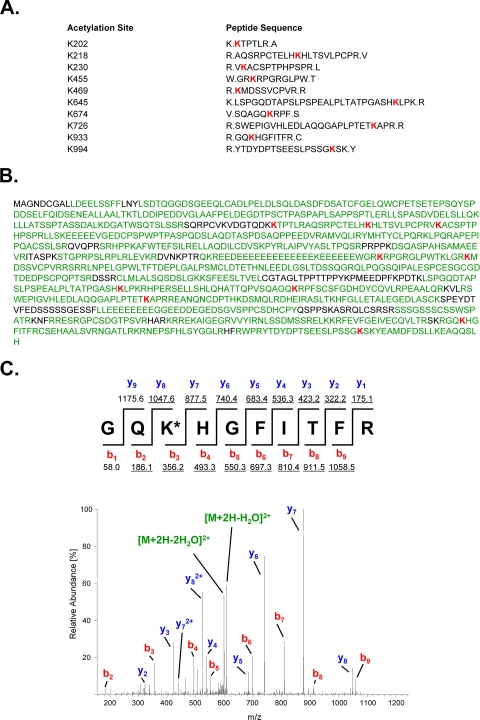
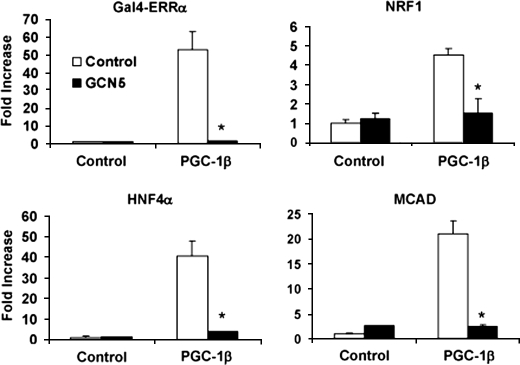
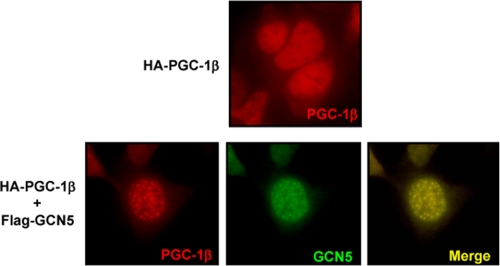
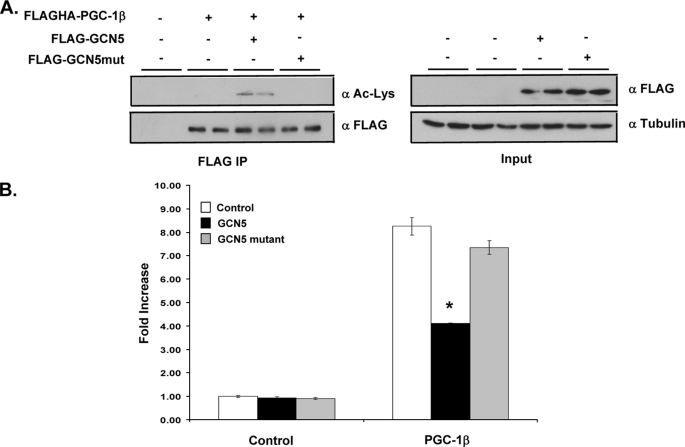
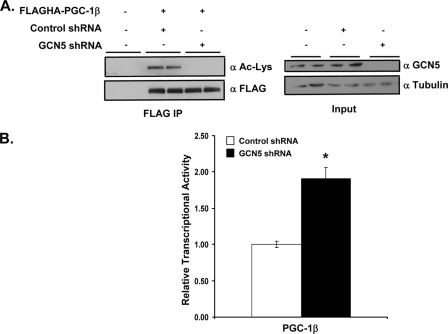
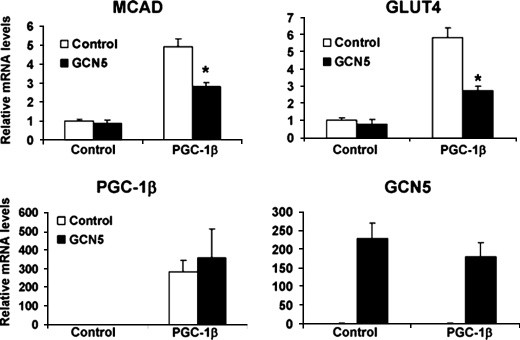
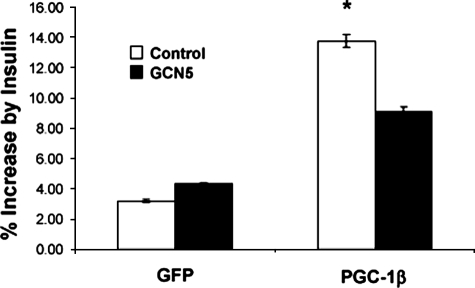
Changes in expression levels of genes encoding for proteins that control metabolic pathways are essential to maintain nutrient and energy homeostasis in individual cells as well as in organisms. An important regulated step in this process is accomplished through covalent chemical modifications of proteins that form complexes with the chromatin of gene promoters. The peroxisome proliferators gamma co-activator 1 (PGC-1) family of transcriptional co-activators comprises important components of a number of these complexes and participates in a large array of glucose and lipid metabolic adaptations. Here, we show that PGC-1beta is acetylated on at least 10 lysine residues distributed along the length of the protein by the acetyl transferase general control of amino-acid synthesis (GCN5) and that this acetylation reaction is reversed by the deacetylase sirtuin 1 (SIRT1). GCN5 strongly interacts with PGC-1beta and represses its transcriptional activity associated with transcription factors such as ERRalpha, NRF-1, and HNF4alpha, however acetylation and transcriptional repression do not occur when a catalytically inactive GCN5 is co-expressed. Transcriptional repression coincides with PGC-1beta redistribution to nuclear foci where it co-localizes with GCN5. Furthermore, knockdown of GCN5 ablates PGC-1beta acetylation and increases transcriptional activity. In primary skeletal muscle cells, PGC-1beta induction of endogenous target genes, including MCAD and GLUT4, is largely repressed by GCN5. Functionally, this translates to a blunted response to PGC-1beta-induced insulin-mediated glucose transport. These results suggest that PGC-1beta acetylation by GCN5 might be an important step in the control of glucose and lipid pathways and its dysregulation could contribute to metabolic diseases.


Figures

FIGURE 1.
FIGURE 1.
GCN5 interacts with and acetylates the transcriptional co-activator PGC-1β. Primary skeletal muscle myotubes were infected with the indicated adenoviruses encoding for FLAG-GCN5 and HA-PGC-1β proteins. A and B, immunoprecipitation with FLAG or HA antibodies linked to agarose was performed followed by Western blot analysis using the indicated antibodies. C, HEK 293 cells were transfected with the indicated plasmids encoding for either FLAG or HA-tagged proteins. PGC-1β was immunoprecipitated from whole cell extracts, and lysine-acetylation was detected using Western blot analysis with the indicated antibodies. D, similar experiments as in C were performed but using the SIRT1 plasmid.
FIGURE 2.
FIGURE 2.
Analysis and identification of PGC-1β lysine acetylation sites. HEK 293 cells were infected with adenoviruses encoding for FLAG-HA-PGC-1β and FLAG-GCN5 and treated with nicotinamide (20 mm) for 12 h. After immunoprecipitation, PGC-1β was separated by SDS-PAGE and analyzed by tandem mass spectrometry. Acetylation was determined by subjecting a tryptic and a chymotryptic digest of the protein to microcapillary LC-MS/MS on a hybrid linear ion trap/FT-ICR mass spectrometer and assigning the acquired MS/MS data using the SEQUEST algorithm as described under “Experimental Procedures.” A, sequences of identified acetylated peptides, including flanking amino acid residues. Acetylated lysine residues are shown in red. B, 87% of the amino acid sequence (74% of lysine residues) of PGC-1β was covered in the acetylation mapping experiment (covered residues are shown in green, acetylated lysine are residues in red). C, determination of acetylation on Lys-933. The lower panel shows the MS/MS of the doubly charged tryptic peptide Gly-931 to Arg-940 (m/z 616.82976, mass accuracy, −1.0 ppm) carrying an acetyl residue on Lyss-933 (red). The sequence of the peptide including m/z values for predicted fragment ions is shown above the spectrum. Detected fragment ions are underlined.
FIGURE 3.
FIGURE 3.
Repression of PGC-1β transcriptional activity through GCN5. HEK 293 cells were transfected with the indicated plasmids. Luciferase activities were measured as described under “Experimental Procedures.” The luciferase reporters were either 5XUAS (for GAL4-ERRα), NRF-1 DNA-binding sites (NRF-1) (8), gAF1 of phosphoenolpyruvate carboxykinase promoter (HNF4α) (45), or the −375 MCAD promoter linked to luciferase as previously described (ERRα) (46). Values represent means ± S.E. of at least three independent experiments performed in duplicate. Statistical significance was determined by two-tailed unpaired Student's t test. *, p < 0.05 control versus GCN5.
FIGURE 4.
FIGURE 4.
PGC-1β nuclear redistribution induced by GCN5. HEK 293 cells were transfected with HA-PGC-1β and FLAG-GCN5. Cells were fixed 48 h after transfection and immunofluorescence was performed using mouse anti-HA antibodies (shown in “red”) and rabbit anti-GCN5 antibodies (shown in “green”).
FIGURE 5.
FIGURE 5.
Mutant GCN5 fails to acetylate PGC-1β and shows little impairment of transcriptional activity. A, HEK 293 cells were transfected with the indicated plasmids encoding either wild-type GCN5 or mutant GCN5. FLAGHA-PGC-1β was overexpressed and immunoprecipitated using FLAG antibody linked to agarose beads. Detection of protein and acetylation levels was completed with Western blot as previous. B, HEK 293 cells were transfected with 5XUAS as well as GAL4-Errα and other indicated plasmids. Luciferase activities were measured as described under “Experimental Procedures.” Values are representative of mean ± S.E. of two experiments each in triplicate Statistical significance was determined by two-tailed unpaired students t test. *, p < 0.05 PGC-1β versus PGC-1β plus GCN5.
FIGURE 6.
FIGURE 6.
Knockdown of GCN5 results in decreased acetylation and increased transcriptional activity of PGC-1β. A, HEK 293 cells were transfected with control or GCN5 shRNA plasmid for 72 h and treated with 10 mm nicotinamide for the final 12 h. Overexpressed FLAGHA-PGC-1β was immunoprecipitated using FLAG antibody linked agarose beads and acetylation status was determined by Western blot. B, HEK 293 cells were transfected with control or GCN5 shRNA plasmid for 72 h along with PGC-1β, Errα, and the −375 MCAD promoter linked to luciferase. Luciferase activities were measured as described under “Experimental Procedures.” Values represent relative means ± S.E. of three experiments each in triplicate. Statistical significance was determined by two-tailed unpaired Student's t test. *, p < 0.005 PGC-1β plus control shRNA versus PGC-1β plus GCN5 shRNA.
FIGURE 7.
FIGURE 7.
GCN5 inhibition of PGC-1β-induced endogenous gene expression in skeletal muscle cells. Primary skeletal muscle myotubes were infected with adenoviruses encoding the indicated proteins. Total RNA was analyzed by RT-PCR 2 days after infection. Values represent means ± S.E. of at least two independent experiments performed in duplicate. Statistical significance determined by two-tailed unpaired Student's t test. *, p < 0.05 PGC-1β versus PGC-1β plus GCN5.
FIGURE 8.
FIGURE 8.
GCN5 blocks PGC-1β-induced insulin-mediated glucose transport. Primary skeletal muscle myotubes were infected with the indicated adenoviruses. Cells were incubated in Dulbecco's modified Eagle's medium with 0.5% bovine serum albumin, treated with 100 nm insulin for 20 min and incubated with [2-3H]deoxyglucose as described under “Experimental Procedures.” Values of % [2-3H]deoxyglucose uptake increased by insulin represent means ± S.E. of six independent experiments performed in triplicate. Statistical significance determined by two-tailed unpaired Student's t test. *, p < 0.05 control versus PGC-1β.

References

    1. Roth S. Y., Denu J. M., Allis C. D. (2001) Annu. Rev. Biochem. 70, 81–120 - PubMed
    1. Kouzarides T. (2007) Cell 128, 693–705 - PubMed
    1. Scarpulla R. C. (2002) Biochim. Biophys. Acta 1576, 1–14 - PubMed
    1. Lin J., Handschin C., Spiegelman B. M. (2005) Cell Metab. 1, 361–370 - PubMed
    1. Finck B. N., Kelly D. P. (2006) J. Clin. Invest. 116, 615–622 - PMC - PubMed

Publication types

MeSH terms

LinkOut - more resources