. 2009 Jul 31;284(31):20848-57.
doi: 10.1074/jbc.M109.007336. Epub 2009 Jun 1.

Specific interaction between tomato HsfA1 and HsfA2 creates hetero-oligomeric superactivator complexes for synergistic activation of heat stress gene expression

Affiliations

Specific interaction between tomato HsfA1 and HsfA2 creates hetero-oligomeric superactivator complexes for synergistic activation of heat stress gene expression

Kwan Yu Chan-Schaminet et al. J Biol Chem. .

Abstract

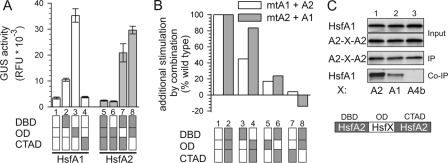
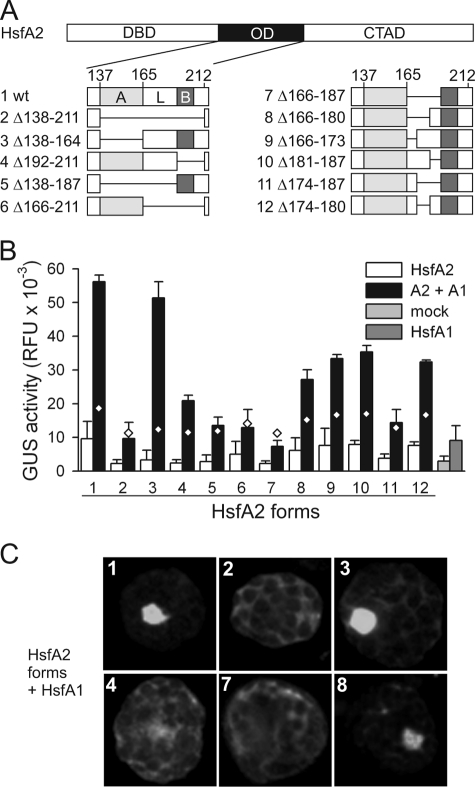
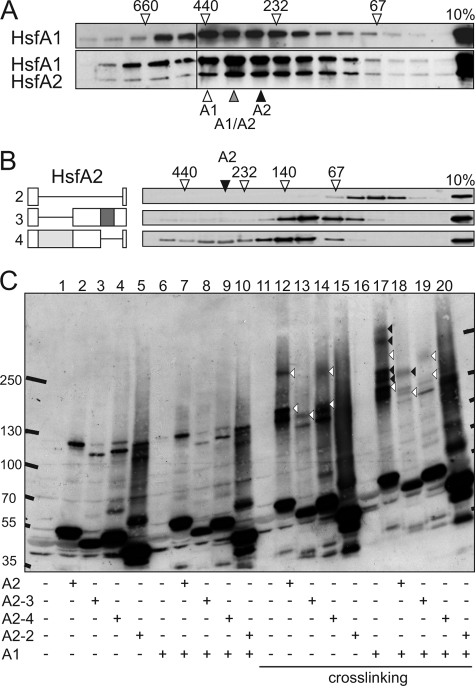
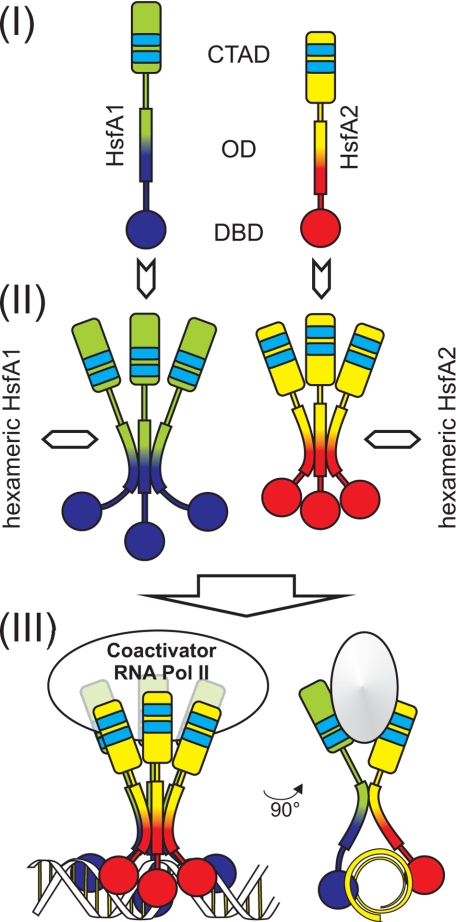
In plants, a family of more than 20 heat stress transcription factors (Hsf) controls the expression of heat stress (hs) genes. There is increasing evidence for the functional diversification between individual members of the Hsf family fulfilling distinct roles in response to various environmental stress conditions and developmental signals. In response to hs, accumulation of both heat stress proteins (Hsp) and Hsfs is induced. In tomato, the physical interaction between the constitutively expressed HsfA1 and the hs-inducible HsfA2 results in synergistic transcriptional activation (superactivation) of hs gene expression. Here, we show that the interaction is strikingly specific and not observed with other class A Hsfs. Hetero-oligomerization of the two-component Hsfs is preferred to homo-oligomerization, and each Hsf in the HsfA1/HsfA2 hetero-oligomeric complex has its characteristic contribution to its function as superactivator. Distinct regions of the oligomerization domain are responsible for specific homo- and hetero-oligomeric interactions leading to the formation of hexameric complexes. The results are summarized in a model of assembly and function of HsfA1/A2 superactivator complexes in hs gene regulation.


Figures

FIGURE 1.
FIGURE 1.
Domain structure of tomato heat stress transcription factors. Numbers indicate amino acid residues. OD, oligomerization domain corresponding to the hydrophobic heptad repeat region (HR-A/B). The term HsfA1 is used synonymously throughout this report and corresponds to the master regulator HsfA1a in Lycopersicon esculentum (3, 25). The patterns of AHA motifs are Hsf-specific (33, 36, 37).
FIGURE 2.
FIGURE 2.
Cooperative action between tomato Hsfs. A–C, Hsf activity was monitored by expression of the Hsf-dependent GUS reporter construct PGmhsp17. 3B-CI::GUS (supplemental Fig. S1) in tobacco protoplasts. A, co-transformation with the indicated amounts of plasmids encoding HsfA1 or HsfA2, either alone (gray and black dots, respectively) or in combination with 1 μg of plasmid encoding the corresponding partner Hsf (diamonds). B and C, same as in A with 0 or 0.5 μg of plasmids encoding the indicated Hsfs, either alone (white bars) or in combination with 1 μg of HsfA1 (B, gray bars) or HsfA2 (C, black bars). Diamonds indicate the additive values of GUS activities determined by transformation of protoplasts with the individual partner Hsfs alone. The synergism of GUS activity for the corresponding Hsf combinations is given as numbers and was calculated as described under “Experimental Procedures.”
FIGURE 3.
FIGURE 3.
Importance of functional domains for interaction and synergistic activity of HsfA1 and HsfA2. A, mutations introduced into HsfA1 and HsfA2 as well as the abbreviations are given (for further details of AHA mutations (mutant forms A) see also Fig. 4A). B and C, analysis of HsfA1/A2 cooperation in reporter gene expression assays in tobacco protoplasts after coexpression of the indicated wild type (wt) and mutant forms (samples 1–12). B, GUS reporter activities are presented as bars and diamonds and indicate the ratio of GUS activities contributed by additive effects (see legend to Fig. 2). Below, expression controls for the transformed Hsf constructs determined by immunoblot analysis are shown. C, expression levels of endogenous Hsp17-CI proteins were determined by immunodecoration performed on the same protein blot used in B. D, co-immunoprecipitation of HsfA1 with anti-HsfA2 antibodies. Expression levels (10% input) for both Hsfs (upper panels) as well as results of immunoprecipitation (IP) of HsfA2 and co-immunoprecipitation (Co-IP) of HsfA1 (lower panels) are shown. The additional band appearing in all lanes of the HsfA2-IP panel results from co-elution of IgG heavy chains. E, expression constructs for HsfA2 (samples 1–4 and 13) and its mutant forms D (samples 5–8), H (samples 9–11), and A (sample 12) with N-terminally fused GFP were transformed alone (images 1, 2, 5, 6, 9, 10, 12) or co-transformed with wt HsfA1 (+HsfA1, samples 3, 7, 11) or its mutant forms D (+HsfA1-D, samples 4, 8) and H (+HsfA1-H, sample 13), respectively. For inhibition of nuclear export, leptomycin B (+LMB, samples 2, 6, 10) was added 2 h before harvesting.
FIGURE 4.
FIGURE 4.
Role of the AHA motifs for the synergistic activity of HsfA1/A2 hetero-oligomers. A, mutations in the AHA1 and AHA2 motifs in the CTADs of HsfA1 and HsfA2, respectively, and annotation of the mutants. As shown previously (32, 37), the complete functional knock-out of HsfA1was only achieved by exchanging all seven indicated amino acid residues to alanine. B, expression levels of wild type (wt) and mutant forms of HsfA1 and HsfA2 after co-expression in combinations as indicated below (upper panels), and stimulation of endogenous Hsp17-CI gene expression in the corresponding samples 1–9 (lower panel).
FIGURE 5.
FIGURE 5.
The synergistic function of HsfA1/A2 complexes depends on the heterologous combination of the oligomerization and the activator domains. A, individual activities of domain-swapping mutants of HsfA1 (white bars) or HsfA2 (gray bars) in the GUS reporter assay. The domain structure of wt HsfA1 (1, white block diagram) and HsfA2 (5, gray block diagram) is compared with the corresponding domain-swapping mutants (2–4 and 6–8). B, ratio of additional stimulation of GUS activity (AS) by combination of the mutants of HsfA1 (samples 3, 5, 7) with wt HsfA2 (white bars) or the mutants of HsfA2 (samples 4, 6, 8) combined with wt HsfA1 (gray bars) compared with the wt combination (samples 1, 2) was calculated as described under “Experimental Procedures.” The corresponding domain-swapping mutants are indicated at the bottom. C, HsfA1 and HsfA2 (wt, lane 1) or mutant forms of HsfA2 containing the HR-A/B domain of HsfA1 (lane 2) or HsfA4b (negative control, lane 3) were co-expressed in tobacco protoplasts and complexes immunoprecipitated with HsfA2 antibodies. The levels of HsfA1 and HsfA2 forms (A2-X-A2) before precipitation (Input), the amount of HsfA2 forms immunoprecipitated (IP), and the amount of HsfA1 co-immunoprecipitated (Co-IP) are shown as indicated. The domain structure of the HsfA2 mutants is illustrated below. For abbreviations see legend to Fig. 1.
FIGURE 6.
FIGURE 6.
Functional dissection of the oligomerization domain. A, deletions in the HsfA2 oligomerization domain are illustrated as bar diagrams and the numbers of deleted amino acid residues are indicated. B, GUS reporter expression in tobacco protoplasts transformed with the indicated HsfA2 forms (constructs 1–12) either alone (white bars) or in combination with HsfA1 (black bars). Bars on the right show the mock result (gray) and the activity of HsfA1 alone (dark gray). Diamonds indicate the additive GUS activity values for each of the indicated HsfA2 mutant form in combination with HsfA1. For control of Hsf expression and induction of endogenous Hsp17-CI expression, see supplemental Fig. S4. C, intracellular localization of the indicated forms of HsfA2 (numbers corresponding to A) with N-terminally fused GFP in protoplasts co-transformed with HsfA1.
FIGURE 7.
FIGURE 7.
SEC and cross-linking of homo- and hetero-oligomeric Hsf complexes. A, protein complexes formed by expression of HsfA1 (top panel) in combination with HsfA2 (bottom panel) in transformed tobacco protoplasts were analyzed by SEC on Superdex 200. Proteins of the consecutive fractions were analyzed by SDS-PAGE and immunoblotting. On the top, migration and molecular sizes of marker proteins are indicated. On the bottom, triangles indicate peak fractions of HsfA1 complexes (white) and HsfA1/A2 co-complexes (gray). The black triangle indicates the corresponding peak fraction of complexes formed by HsfA2 alone (deduced from Fig. 5A in Ref. 28). B, SEC of complexes formed by HsfA2 mutants with deletions in the HR-A/B region as illustrated on left (numbering as in Fig. 6). The peak fraction corresponding to the size of wt HsfA2 complexes is indicated as in A. C, HsfA1, HsfA2, and its mutants were expressed either alone or in combination in tobacco protoplasts as indicated on the bottom. Aliquots of protein extracts were incubated before (lanes 1–10) or after chemical cross-linking (lanes 11–20) as described under “Experimental Procedures.” Shown is the immunoblot processed with antibodies against HsfA2. Extract of protoplasts transformed with empty vector was loaded for control (lanes 1 and 11). The position of marker proteins is indicated on the left and right margin. Estimation of relative molecular weights was done after compensation of bending (not shown). White arrowheads indicate cross-linking products formed by HsfA2 or its mutants alone; black arrowheads indicate cross-linking products formed by HsfA1/A2.
FIGURE 8.
FIGURE 8.
Model of plant Hsf assembly. Monomeric Hsfs (i) assemble to a trimeric homo-oligomer (ii) by interaction via HR-A. The trimer forms a hexamer through heterodimeric interactions (iii) mediated by the linker and HR-B. To illustrate the two types of interactions, a 90° rotation of the model is shown on the right. For further details see “Discussion.”

Similar articles

Cited by

References

    1. Morimoto R. I. (1998) Genes Dev. 12, 3788–3796 - PubMed
    1. Schöffl F., Prändl R., Reindl A. (1998) Plant Physiol. 117, 1135–1141 - PMC - PubMed
    1. Baniwal S. K., Bharti K., Chan K. Y., Fauth M., Ganguli A., Kotak S., Mishra S. K., Nover L., Port M., Scharf K. D., Tripp J., Weber C., Zielinski D., von Koskull-Döring P. (2004) J. Biosci. 29, 471–487 - PubMed
    1. von Koskull-Döring P., Scharf K. D., Nover L. (2007) Trends Plant Sci. 12, 452–457 - PubMed
    1. Akerfelt M., Trouillet D., Mezger V., Sistonen L. (2007) Ann. N.Y. Acad. Sci. 1113, 15–27 - PubMed

Publication types

MeSH terms