. 2009 Aug;19(8):1462-70.
doi: 10.1101/gr.091447.109. Epub 2009 Jun 2.

Genome-wide screen of promoter methylation identifies novel markers in melanoma

Affiliations

Genome-wide screen of promoter methylation identifies novel markers in melanoma

Yasuo Koga et al. Genome Res. 2009 Aug.

Abstract

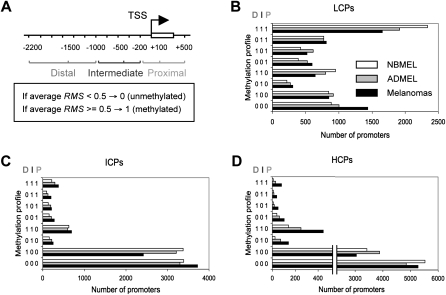
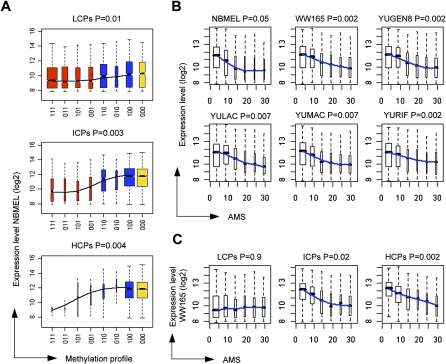
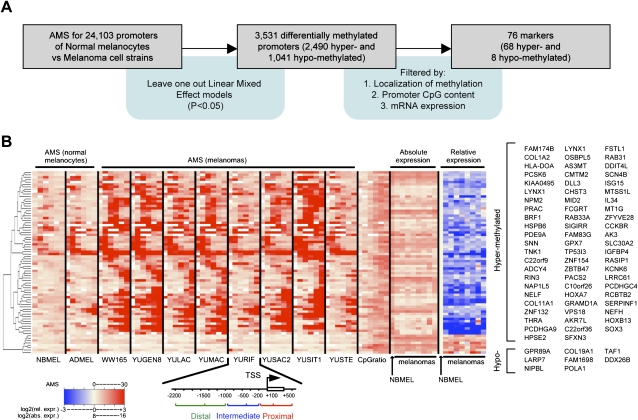
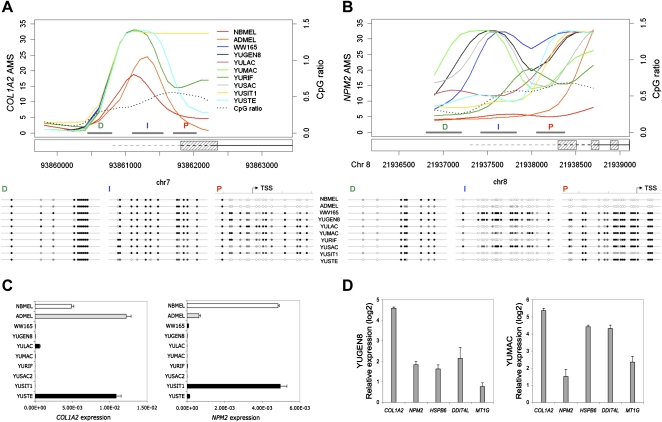
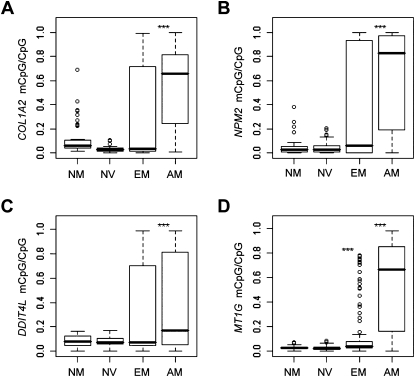
DNA methylation is an important component of epigenetic modifications, which influences the transcriptional machinery aberrant in many human diseases. In this study we present the first genome-wide integrative analysis of promoter methylation and gene expression for the identification of methylation markers in melanoma. Genome-wide promoter methylation and gene expression of eight early-passage human melanoma cell strains were compared with newborn and adult melanocytes. We used linear mixed effect models (LME) in combination with a series of filters based on the localization of promoter methylation relative to the transcription start site, overall promoter CpG content, and differential gene expression to discover DNA methylation markers. This approach identified 76 markers, of which 68 were hyper- and eight hypomethylated (LME, P < 0.05). Promoter methylation and differential gene expression of five markers (COL1A2, NPM2, HSPB6, DDIT4L, MT1G) were validated by sequencing of bisulfite-modified DNA and real-time reverse transcriptase PCR, respectively. Importantly, the incidence of promoter methylation of the validated markers increased moderately in early and significantly in advanced-stage melanomas, using early-passage cell strains and snap-frozen tissues (n = 18 and n = 24, respectively) compared with normal melanocytes and nevi (n = 11 and n = 9, respectively). Our approach allows robust identification of methylation markers that can be applied to other studies involving genome-wide promoter methylation. In conclusion, this study represents the first unbiased systematic effort to determine methylation markers in melanoma and revealed several novel genes regulated by promoter methylation that were not described in cancer cells before.


Figures

Figure 1.
Figure 1.
Distribution of promoter methylation in normal melanocytes and melanoma cells. (A) Diagram showing the three promoter regions relative to the TSS: Proximal (−200 to +500 bp), Intermediate (−200 to −1000 bp), and Distal (−1000 to −2200 bp). Each region is labeled as highly methylated (1) or unmethylated (0) if its average probe-level RMS is higher or lower than 0.5, respectively. (B) Number of LCPs for each cell type (NBMEL, ADMEL, and melanomas) and for each methylation profile. (e.g., 111 fully methylated, 001 proximally methylated, and combination thereof). (C,D) The same as B, for ICPs and HCPs.
Figure 2.
Figure 2.
Promoter methylation and transcriptional repression. (A) Gene expression in normal melanocytes (NBMEL) under the control of promoters with each methylation profile in each promoter category; red and blue groups indicate promoters with and without proximal methylation (XX1 and XX0 profiles, respectively); yellow indicates unmethylated promoters; the groups range from fully methylated to unmethylated from left to right, and the order is based on the progressive absence of methylation from distal to proximal regions; smoothing over the median for each group is shown. (B) Gene expression in normal melanocytes (NBMEL) and five melanoma cell strains as a function of the probe-level AMS of proximal promoters; smoothing over the median for each group is shown. (C) Gene expression of WW165 primary melanoma cells for each promoter category as a function of the probe-level AMS of proximal promoters; smoothing over the median for each group is shown. For each panel the trend P-value is indicated (see Methods).
Figure 3.
Figure 3.
Selection of promoter methylation markers. (A) Outline of the pipeline used to identify markers. (B) Heat-map of the selected markers; promoter AMS for newborn melanocytes (NBMEL), adult melanocytes (ADMEL), and eight melanoma cell strains, and CpG ratio in each of six regions is represented; absolute gene expression as well the expression relative to newborn melanocytes (NBMEL) are displayed; gene symbols of differentially expressed genes are shown on the right side in order of significance, top to bottom from the left column. Two alternative promoters are displayed for LYNX1 (see Supplemental Table S1).
Figure 4.
Figure 4.
Promoter methylation and gene expression for selected markers. (A) Probe-level AMS, CpG ratio, and sequence of BS-modified genomic DNA for the proximal (P), intermediate (I), and distal (D) promoter regions of COL1A2 in newborn (NBMEL) and adult (ADMEL) melanocytes and eight melanoma cell strains; gray bars indicate the amplicons of BS sequencing; D, distal, I, intermediate, and P, proximal for each promoter region; 1 kb upstream region (dashed line), exon (dashed box), and coding sequences (solid black line) for each RefSeq in the locus are displayed; CpGs are represented as circles, and white, gray, and black shades refer to the average of mCpG/CpG (0 to 1) for each sample. (B) Same as A, for NPM2. (C) COL1A2 and NPM2 expression levels measured by real-time RT-PCR. Expression levels were normalized to that of ACTB. (D) Restoration of gene expression (COL1A2, DDIT4L, NPM2, and MT1G) after treatment with Aza (0.2 μM). Gene transcripts were measured by real-time RT-PCR, and expression levels were normalized to that of ACTB. The histogram shows log2 increase after Aza treatment for YUGEN8 and YUMAC melanoma cells.
Figure 5.
Figure 5.
Promoter methylation of selected markers in early-passage cells results from sequencing of BS. Modified DNA was used to determine the methylation level of each CpG dinucleotide within each proximal promoter. The distribution of CpG-relative methylation is displayed in normal melanocytes (NM, n = 5), nevi (NV, n = 6), early-stage melanomas (EM, n = 8), and advanced-stage melanomas (AM, n = 10). P-values for each group were determined relative to NM using a two-sample nonparametric Wilcoxon test. 0.05 < *P ≤ 0.01, 0.01 < **P ≤ 0.001, ***P < 0.001. (A) COL1A2; (B) NPM2; (C) DDIT4L; (D) MT1G.

Similar articles

Cited by

References

    1. Anderton JA, Lindsey JC, Lusher ME, Gilbertson RJ, Bailey S, Ellison DW, Clifford SC. Global analysis of the medulloblastoma epigenome identifies disease subgroup-specific inactivation of COL1A2. Neuro Oncol. 2008;10:981–994. - PMC - PubMed
    1. Ball MP, Li JB, Gao Y, Lee JH, LeProust EM, Park IH, Xie B, Daley GQ, Church GM. Targeted and genome-scale strategies reveal gene-body methylation signatures in human cells. Nat Biotechnol. 2009;27:361–368. - PMC - PubMed
    1. Bird AP, Wolffe AP. Methylation-induced repression—belts, braces, and chromatin. Cell. 1999;99:451–454. - PubMed
    1. Catalina P, Montes R, Ligero G, Sanchez L, de la Cueva T, Bueno C, Leone PE, Menendez P. Human ESCs predisposition to karyotypic instability: Is a matter of culture adaptation or differential vulnerability among hESC lines due to inherent properties? Mol Cancer. 2008;7:76. doi: 10.1186/1476-4598-7-76. - DOI - PMC - PubMed
    1. Cheng E, Trombetta SE, Kovacs D, Beech RD, Ariyan S, Reyes-Mugica M, McNiff JM, Narayan D, Kluger HM, Picardo M, et al. Rab33A: Characterization, expression, and suppression by epigenetic modification. J Invest Dermatol. 2006;126:2257–2271. - PubMed

Publication types

MeSH terms