. 2009 Aug;58(8):1902-13.
doi: 10.2337/db08-1327. Epub 2009 Jun 2.

Nanoparticle-mediated expression of an angiogenic inhibitor ameliorates ischemia-induced retinal neovascularization and diabetes-induced retinal vascular leakage

Affiliations

Nanoparticle-mediated expression of an angiogenic inhibitor ameliorates ischemia-induced retinal neovascularization and diabetes-induced retinal vascular leakage

Kyoungmin Park et al. Diabetes. 2009 Aug.

Abstract

Objective: The aim of the study is to evaluate the effect of nanoparticle-mediated gene delivery of angiogenic inhibitors on retinal inflammation, vascular leakage, and neovascularization in diabetic retinopathy.

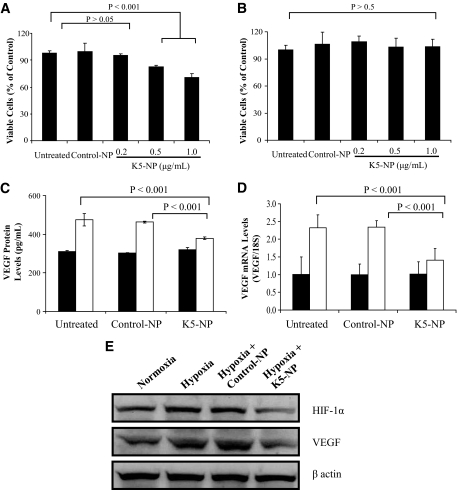
Research design and methods: An expression plasmid of plasminogen kringle 5 (K5), a natural angiogenic inhibitor, was encapsulated with poly(lactide-coglycolide) to form K5 nanoparticles (K5-NP). Expression of K5 was determined by Western blot analysis and immunohistochemistry, and retinal vascular leakage was measured by permeability assay. Retinal neovascularization was evaluated using fluorescein-angiography and counting preretinal vascular cells in rats with oxygen-induced retinopathy. Effects of K5-NP on retinal inflammation were evaluated in streptozotocin-induced diabetic rats by leukostasis assay and Western blot analysis of intracellular adhesion molecule and vascular endothelial growth factor. Possible toxicities of K5-NP were evaluated using histology examination, retinal thickness measurement, and electroretinogram recording.

Results: K5-NP mediated efficient expression of K5 and specifically inhibited growth of endothelial cells. An intravitreal injection of K5-NP resulted in high-level expression of K5 in the inner retina of rats during the 4 weeks they were analyzed. Injection of K5-NP significantly reduced retinal vascular leakage and attenuated retinal neovascularization, when compared with the contralateral eyes injected with Control-NP in oxygen-induced retinopathy rats. K5-NP attenuated vascular endothelial growth factor and intracellular adhesion molecule-1 overexpression and reduced leukostasis and vascular leakage for at least 4 weeks after a single injection in the retina of streptozotocin-induced diabetic rats. No toxicities of K5-NP were detected to retinal structure and function.

Conclusions: K5-NP mediates efficient and sustained K5 expression in the retina and has therapeutic potential for diabetic retinopathy.


Figures

FIG. 1
FIG. 1
K5 expression from K5-NP in vitro. ARPE19 cells were grown to 70% confluence in a medium containing 5% FBS. The culture medium was replaced by a serum-free medium. Control-NP and K5-NP were separately added into the medium to 1 μg/ml (plasmid DNA concentration) and incubated with the cells for 72 h. A: The medium was collected and concentrated. Total protein concentrations in the media were measured using the Bradford assay. The same amount of total proteins (20 μg) was applied for Western blot analysis separately using an antibody specific for human K5 and an anti–His-tag antibody. Lane 1, molecular weight markers; lane 2, medium from cells treated with K5-NP; lane 3, untreated cells; lane 4, treated with control-NP; lane 5, purified K5 peptide as positive control. B and C: ARPE19 cells were grown overnight on glass slides, treated with K5-NP and control-NP at 1 μg/ml for 72 h, washed, and fixed. The cells were immunostained with a monoclonal antibody against the His-tag using a 3,3′-diaminobenzidine color reaction that shows brown color in cells with positive immunostaining. B: 100×, C: 400×. (A high-quality digital representation of this figure is available in the online issue.)
FIG. 2
FIG. 2
Inhibitory effect of K5-NP on endothelial cell growth and VEGF overexpression under hypoxia. A: BRCECs grown in media containing 1% FBS were treated with K5-NP at the concentrations as indicated for 72 h. The viable cells were quantified using the MTT assay. K5-NP induced a dose-dependent decrease of cell viability in BRCECs. B: At the same concentrations, K5-NP did not inhibit ARPE19 cell growth. C: ARPE19 cells were treated separately with 1 μg/ml control-NP and K5-NP for 72 h. The culture medium was replaced with a serum-free medium, and the cells were exposed to hypoxia for 24 h. VEGF secreted into the medium was measured by ELISA using an ELISA kit (R&D Systems, Minneapolis, MN) and normalized by total protein concentrations in the medium. D: Total RNA was extracted from the treated ARPE19 cells, and VEGF mRNA levels were quantified by RT-PCR and normalized by 18S rRNA levels. Values are mean ± SD (n = 3). □, Hypoxia; ■, normoxia. E: Müller cells were treated separately with 1 μg/ml control-NP and K5-NP for 72 h. The culture medium was replaced with a serum-free medium, and the cells were exposed to hypoxia for 24 h. VEGF and HIF-1α levels were analyzed by immunoblotting and normalized by β-actin levels.
FIG. 3
FIG. 3
K5 expression in the rat retina after an intravitreal injection of K5-NP. A–D: K5-NP was injected into the vitreous of the right eyes and control-NP into the contralateral eyes of four OIR rats at P12. K5 expression was examined at P18 by immunohistochemistry in ocular sections using an anti–His-tag antibody (green). The nuclei were counterstained with DAPI (red). A and C: Representative immunostaining images from the eyes injected with K5-NP (A) and control-NP (C). B and D: Phase contrast images of the same areas shown in A and C, respectively. Scale bar: 20 μm. E: K5-NP and control-NP were separately injected into the vitreous. The retinas were dissected at 1, 2, 3, and 4 weeks after the injection of K5-NP or control-NP (three rats per time point). The same amount of proteins (100 μg) from each retina was loaded for Western blot analysis using the anti–His-tag antibody. The same membrane was striped and re-blotted with an anti–β-actin antibody. No K5 expression was found in the retinas injected with control-NP, whereas K5 expression was detected in all of the retinas with the K5-NP injection. GCL, ganglion cell layer; INL, inner nuclear layer; ONL, outer nuclear layer; RPE, retinal pigment epithelium. (A high-quality digital representation of this figure is available in the online issue.)
FIG. 4
FIG. 4
Effect of K5-NP on retinal vascular leakage in OIR rats. OIR rats received an intravitreal injection of 2.2 μg (A) or 8.8 μg (B) of K5-NP into the right eyes and the same dose of control-NP into the left eyes at P12. Retinal vascular permeability was measured using the Evans blue-albumin leakage method at P16. The vascular leakage was normalized by total protein concentrations in the retina, averaged within the group (mean ± SD, n = 7) and compared with contralateral eyes using paired Student's t test. The eyes injected with 8.8 μg of K5-NP showed a significantly lower retinal vascular permeability compared with the contralateral eye (P = 0.011) (B).
FIG. 5
FIG. 5
Effect of K5-NP on retinal neovascularization in OIR rats. K5-NP was injected into the vitreous of the right eyes (8.8 μg/eye) and the same amount of control-NP into the contralateral eyes of seven OIR rats at P12. Retinal vasculature was examined using fluorescein angiography at P18 as described in methods. A and C: Representative retinal angiographs from the eyes injected with control-NP; B and D are representative angiographs from the K5-NP–injected eyes (40× in A and B; 100× in C and D). Scale bar: A and B, 100 μm; C and D, 40 μm. E: Retinal neovascularization was quantified by measuring the neovascular area in the retina and expressed as percent of the total retina area (mean ± SD, n = 7). The difference of the neovascular area was compared with the contralateral eyes using paired Student's t test. (A high-quality digital representation of this figure is available in the online issue.)
FIG. 6
FIG. 6
Effect of K5-NP on preretinal neovascularization in OIR rats. K5-NP was injected intravitreally into the right eyes and control-NP into the left eyes of six OIR rats at P12. The eyes were fixed, sectioned, and stained with hematoxylin and eosin at P18. A and B: Representative sections from the eyes injected with control-NP (A) and from that with K5-NP (B) injection. Scale bar: 40 μm. C: Preretinal vascular cells were counted in eight noncontinuous sections per eye and averaged as described in research design and methods. The average numbers of preretinal vascular cells (mean ± SD, n = 6) were compared with the eyes injected with K5-NP and those with Control-NP using paired Student's t test. (A high-quality digital representation of this figure is available in the online issue.)
FIG. 7
FIG. 7
Effect of K5-NP on retinal vascular leakage and expression of VEGF and ICAM-1 in diabetic rats. STZ-induced diabetic rats at 2 weeks after the onset of diabetes received an intravitreal injection of 5 μg/eye of K5-NP in the treatment group and the same dose of control-NP in the control group. A: Four weeks after the injection, retinal levels of ICAM-1 and VEGF from nondiabetic control, untreated diabetic rats, and diabetic rats treated with control-NP and K5-NP were determined using immunoblotting. The same membrane was stripped and re-blotted with the anti–His-tag and anti–β-actin antibodies. Retinal levels of VEGF and ICAM-1 in diabetic rats treated with control-NP and K5-NP were quantified by densitometry and expressed as percent of that in nondiabetic rat retinas (mean ± SD, n = 3). B: Retinal vascular permeability in the retina of nondiabetic rats, untreated diabetic rats, and diabetic rats treated with control-NP and K5-NP was measured using the Evans blue-albumin leakage method at 4 weeks after the injection of control-NP or K5-NP, normalized by the total protein concentration in the retina and the Evans blue concentration in the blood and expressed as nanogram dye per milligram of retinal proteins (mean ± SD, n = 8).
FIG. 8
FIG. 8
Histology and ERG response in the eyes injected with K5-NP. Adult rats received an intravitreal injection of K5-NP or control-NP. The animals were killed, and the eye sections were stained with hematoxylin and eosin (three rats per time point). A–F: Representative images of the eyes at 1 (A, D), 2 (B, E), and 4 (C, F) weeks after the injection. Scale bar: 20 μm. G and H: ERG was recorded from six rats at 4 weeks after the injection of K5-NP and Control-NP to nondiabetic and diabetic rats and age-matched untreated nondiabetic and diabetic rats. Amplitudes of A- and B-waves from scotopic and photopic ERG were averaged and compared (mean ± SD, n = 6). □, Normal; formula image, normal + control-NP; formula image, normal + K5-NP; ■, STZ; ▧, STZ + control-NP; ▩, STZ + K5-NP. GCL, ganglion cell layer; INL, inner nuclear layer; ONL, outer nuclear layer; RPE, retinal pigment epithelium. (A high-quality digital representation of this figure is available in the online issue.)
FIG. 9
FIG. 9
Blockade of nuclear translocation of HIF-1α by K5-NP. A: BRCECs were treated with K5-NP or control-NP for 48 h under normoxia or hypoxia (1% oxygen). The cytosol and nucleus were isolated, and the same amount of proteins (30 μg) from each sample was used for Western blot analysis using an anti–HIF-1α antibody. The membranes were stripped and re-blotted with antibodies for β-actin and nuclear protein TBP. Cytosolic and nuclear levels of HIF-1α were semi-quantified by densitometry, normalized by β-actin and TBP, respectively, and expressed as percent of nondiabetic control (mean ± SD, n = 3). B–G: Three OIR rats received an intravitreal injection of control-NP in the left eye (B–D) and K5-NP into the right eye (E–G) at P12. The eyes were fixed and sectioned at P16. The retinal sections were stained with the antibody specific for HIF-1α (green) and the nuclei counterstained with DAPI (red). B and E: HIF-1α immunostaining; C and F: DAPI staining of the nuclei; D and G: merged images of HIF-1α and DAPI staining. Note that the nuclei with increased HIF-1α signal superimposed on DAPI staining show orange color in D. White arrows indicate different intensities of HIF-1α staining in the nuclei of inner retinal cells in D and G. Scale bar: 10 μm. (A high-quality digital representation of this figure is available in the online issue.)

Similar articles

Cited by

References

    1. Aiello LP, Gardner TW, King GL, Blankenship G, Cavallerano JD, Ferris FL, 3rd, Klein R: Diabetic retinopathy. Diabetes Care 1998; 21: 143– 156 - PubMed
    1. Gardner TW, Antonetti DA, Barber AJ, LaNoue KF, Levison SW: Diabetic retinopathy: more than meets the eye. Surv Ophthalmol 2002; 2( Suppl.): S253– S262 - PubMed
    1. Kern TS: Contributions of inflammatory processes to the development of the early stages of diabetic retinopathy. Exp Diabetes Res 2007; 2007: 95103. - PMC - PubMed
    1. Miller JW: Vascular endothelial growth factor and ocular neovascularization. Am J Pathol 1997; 151: 13– 23 - PMC - PubMed
    1. Smith LE: Pathogenesis of retinopathy of prematurity. Semin Neonatol 2003; 8: 469– 473 - PubMed

Publication types

MeSH terms