. 2009 Jun 15;69(12):5168-76.
doi: 10.1158/0008-5472.CAN-08-4238. Epub 2009 Jun 2.

The mRNA-destabilizing protein tristetraprolin is suppressed in many cancers, altering tumorigenic phenotypes and patient prognosis

Affiliations

The mRNA-destabilizing protein tristetraprolin is suppressed in many cancers, altering tumorigenic phenotypes and patient prognosis

Sarah E Brennan et al. Cancer Res. .

Abstract

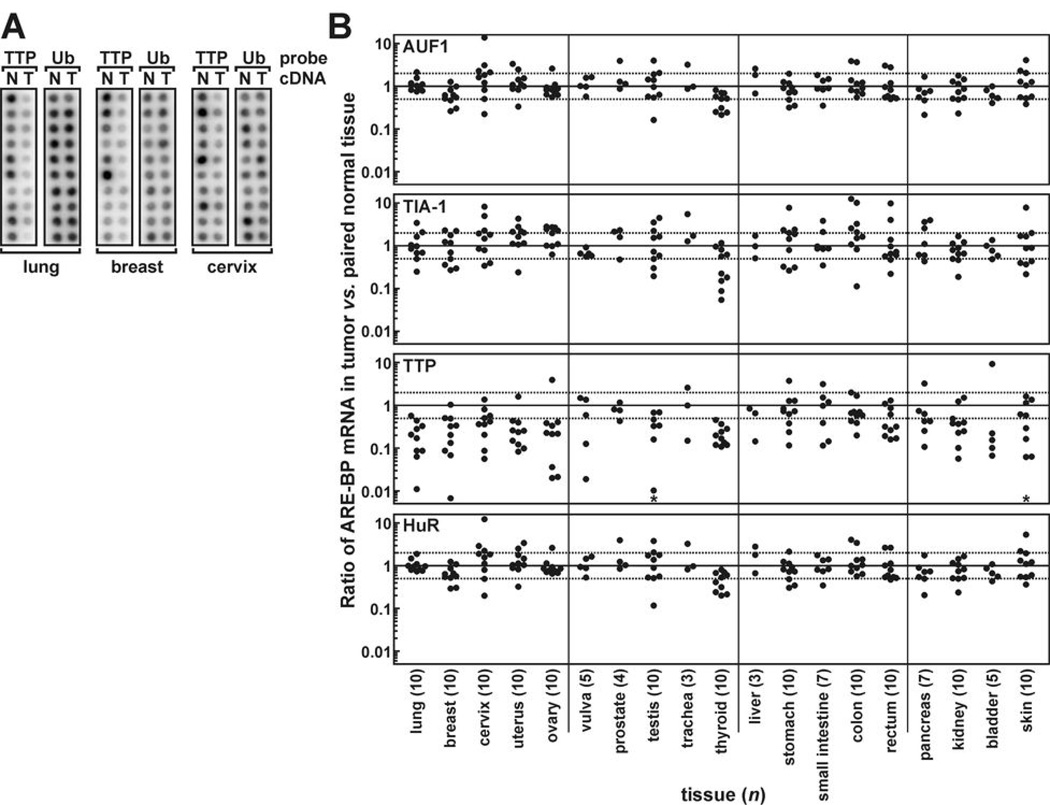
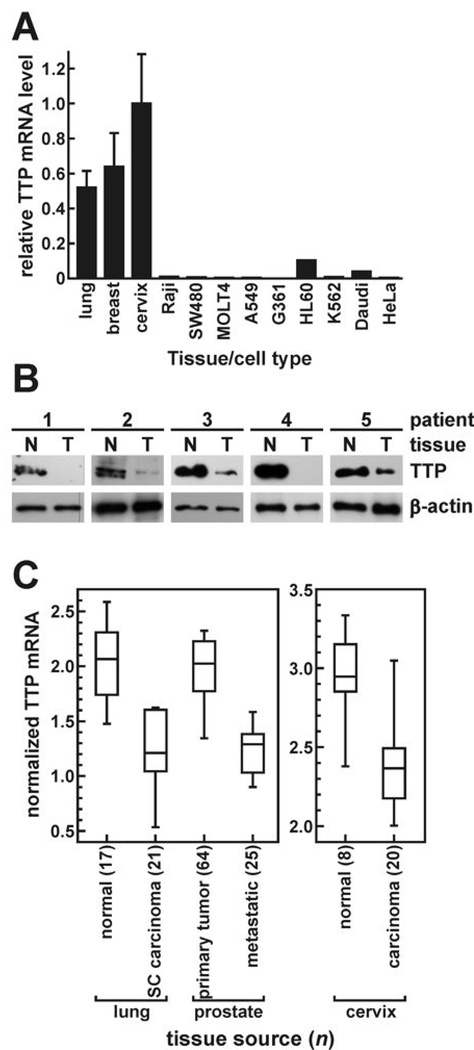
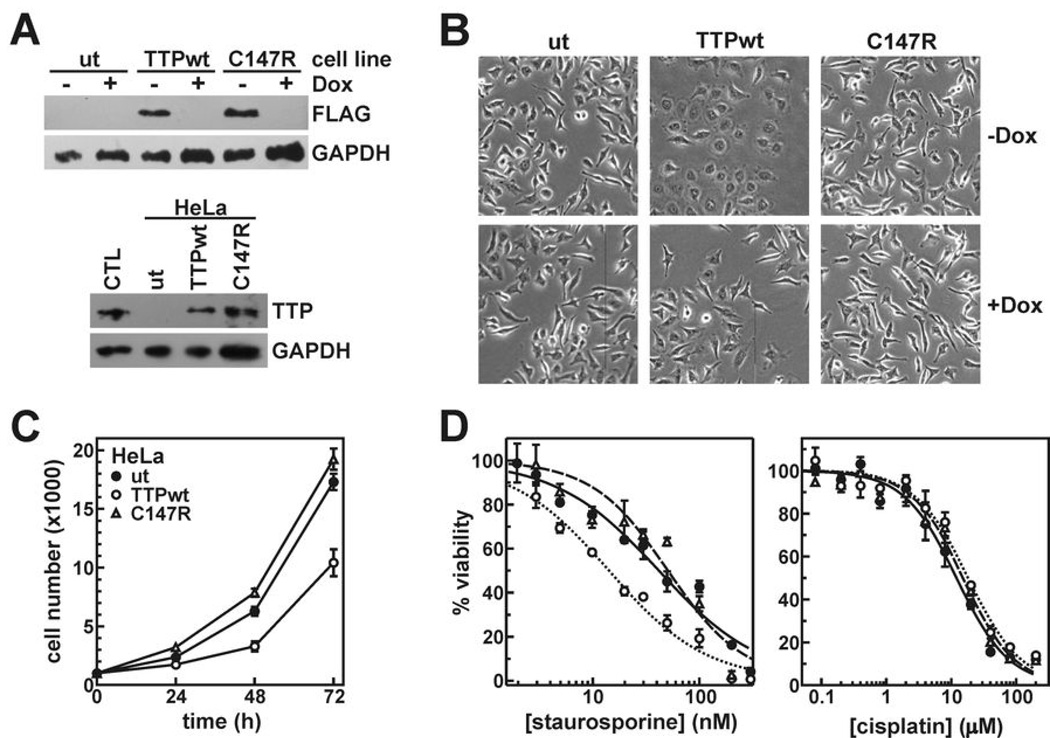
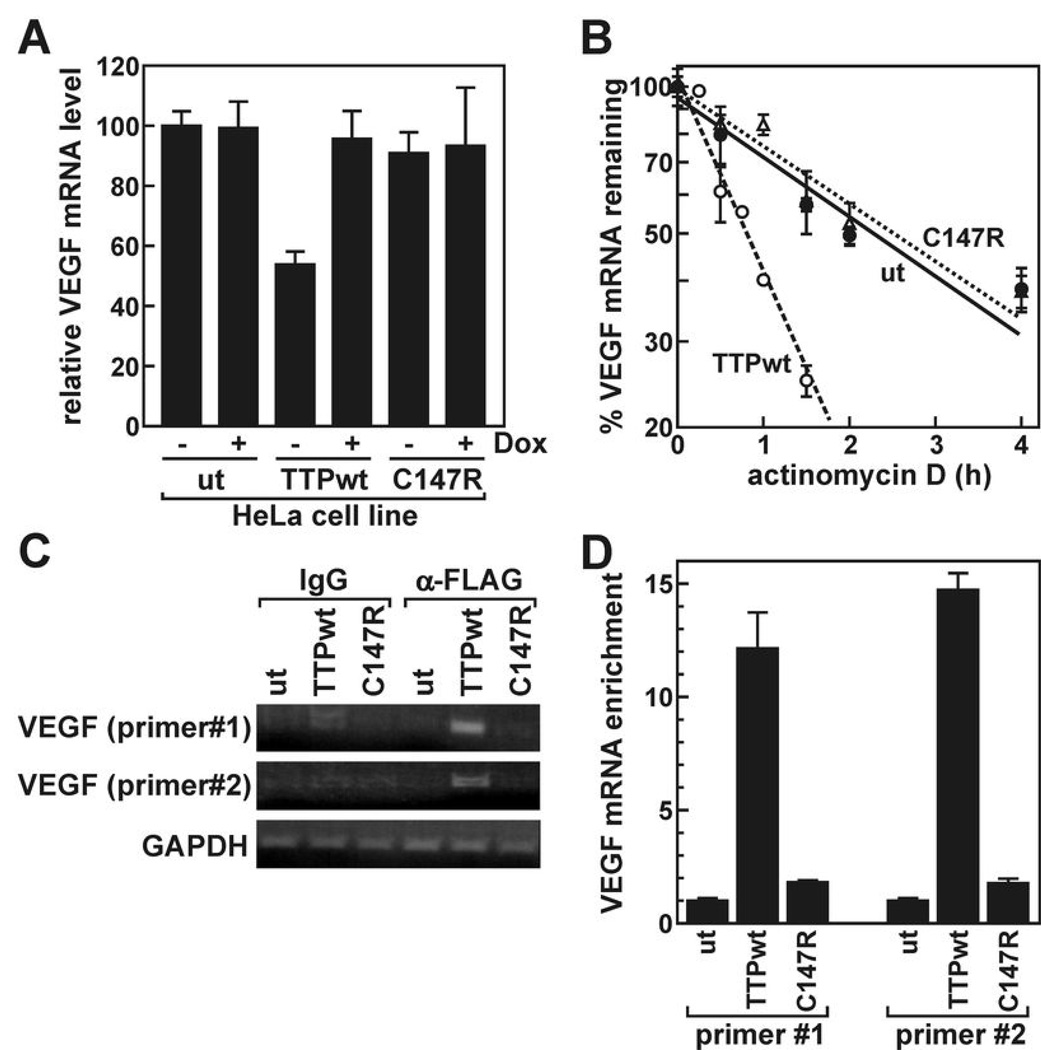
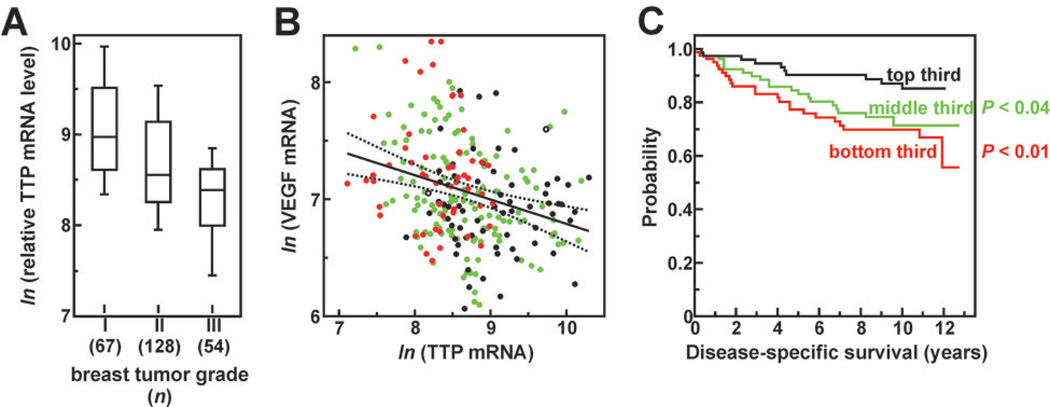
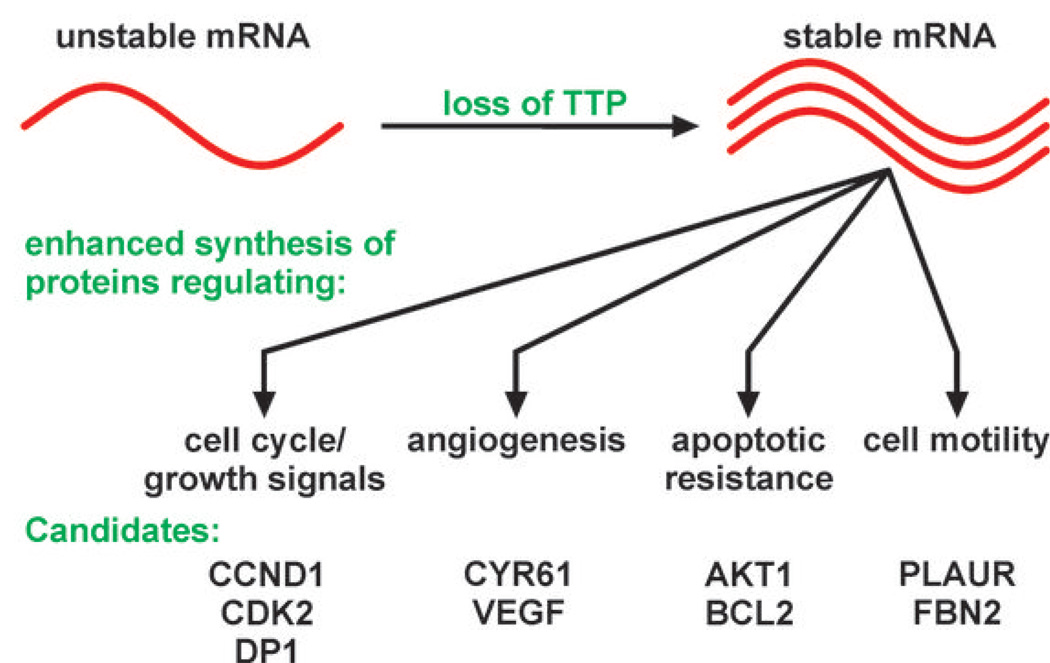
AU-rich element-binding proteins (ARE-BP) regulate the stability and/or translational efficiency of mRNAs containing cognate binding sites. Many targeted transcripts encode factors that control processes such as cell division, apoptosis, and angiogenesis, suggesting that dysregulated ARE-BP expression could dramatically influence oncogenic phenotypes. Using several approaches, we evaluated the expression of four well-characterized ARE-BPs across a variety of human neoplastic syndromes. AUF1, TIA-1, and HuR mRNAs were not systematically dysregulated in cancers; however, tristetraprolin mRNA levels were significantly decreased across many tumor types, including advanced cancers of the breast and prostate. Restoring tristetraprolin expression in an aggressive tumor cell line suppressed three key tumorgenic phenotypes: cell proliferation, resistance to proapoptotic stimuli, and expression of vascular endothelial growth factor mRNA. However, the cellular consequences of tristetraprolin expression varied across different cell models. Analyses of gene array data sets revealed that suppression of tristetraprolin expression is a negative prognostic indicator in breast cancer, because patients with low tumor tristetraprolin mRNA levels were more likely to present increased pathologic tumor grade, vascular endothelial growth factor expression, and mortality from recurrent disease. Collectively, these data establish that tristetraprolin expression is frequently suppressed in human cancers, which in turn can alter tumorigenic phenotypes that influence patient outcomes.


Conflict of interest statement

Potential conflicts of interest: The authors have filed a patent application covering the measurement of TTP expression as an oncological diagnostic and prognostic tool.

Figures

Figure 1
Figure 1
ARE-BP mRNA levels in tumors versus peripheral non-transformed tissues. A cDNA Cancer Profiling Array was probed for selected ARE-BP mRNAs. A, array hybridization signals from lung, breast, and cervical cDNA samples probed for TTP and ubiquitin (ub) expression in tumors (T) and patient-matched, non-transformed peripheral tissue (N). B, scatter plots showing ubiquitin-normalized ratios of AUF1, TIA-1, TTP, and HuR cDNAs derived from tumors versus patient-matched normal tissues. Solid lines (ratio = 1) indicate equivalent ARE-BP expression in tumors and normal tissues, dotted lines show a 100% increase or 50% decrease in tumor versus normal tissues, and n is the number of matched patient sample pairs for each tissue type (bottom). Asterisks in TTP panels denote selected tumors (3 testicular, 1 skin) where TTP cDNA was undetectable above background.
Figure 2
Figure 2
Repression of TTP expression in cancer cell lines and human tumors. A, TTP mRNA was measured in nine human cancer cell lines concomitantly with tissue samples on the Cancer Profiling Array. Bars labeled lung, breast, and cervix are the mean TTP hybridization signals (± SD) from ten non-transformed tissues normalized to ubiquitin. B, Western blots probed for TTP and β-actin proteins in whole cell extracts from breast tumors (T) and patient-matched non-transformed tissue (N) from five patients: 1, invasive lobular, undefined grade; 2, invasive ductal and ductal carcinoma in situ (DCIS), grade 3 (Nottingham); 3, poorly differentiated invasive carcinoma, grade 3; 4, infiltrating ductal carcinoma and DCIS, grade 2; and 5, extensive DCIS, undefined grade. C, gene array datasets were screened for differential TTP mRNA levels using Oncomine v3. Median TTP mRNA levels are shown by solid lines within each box on distribution plots. Box upper and lower limits represent the 75th and 25th percentiles, respectively, while the extended lines indicate 10th and 90th percentiles. Analysis methods, statistical comparisons, and dataset sources are included in Supplementary Table S2.
Figure 3
Figure 3
Influence of TTP on tumor cell phenotypes. A, Western blots showing expression of FLAG-TTPwt and -C147R in HeLa/Tet-Off clones 24 hours after removal of Dox (top) and compared to endogenous TTP protein in a cervical tissue lysate (CTL) using anti-TTP antibodies (bottom). B, phase contrast photomicrographs of HeLa clones before (+Dox) and after (-Dox) induction of FLAG-TTPwt and -C147R. C, proliferation of untransfected HeLa cells (ut, closed circles) or cells expressing FLAG-TTPwt (open circles) or FLAG-C147R (triangles). Each point represents the mean ± SD of at least five cell populations. Triplicate independent experiments yielded similar results. D, untransfected or TTPwt/C147R-expressing HeLa cells were counted 24 hours after treatment with various concentrations of staurosporine and cisplatin. Symbol assignments are identical to C and represent the mean ± SD of four cell populations. IC50 values from multiple independent experiments are summarized in Supplementary Table S4.
Figure 4
Figure 4
Recognition and regulation of VEGF mRNA by TTP. A, VEGF mRNA levels were measured by qRT-PCR in untransfected HeLa cells (ut) or cells stably transfected with FLAG-TTPwt or -C147R prior to (+Dox) and 24 hours following (-Dox) transgene induction. Bars represent the mean ± SD of three independent samples normalized to GAPDH mRNA. B, actD time courses measuring VEGF mRNA decay kinetics in each HeLa line 24 hours following transgene induction. mRNA half-lives resolved from multiple independent experiments are given in the text. C, RNP-IP experiments were performed using control IgG or anti-FLAG antibodies and lysates from indicated HeLa lines, then screened for VEGF and GAPDH mRNAs by qualitative RT-PCR. D, VEGF mRNA levels were measured from anti-FLAG RNP-IPs by qRT-PCR and normalized to GAPDH mRNA (mean ± SD of three reactions). An independent replicate experiment yielded similar results.
Figure 5
Figure 5
Correlation analyses of TTP expression versus pathological features and clinical outcomes in breast cancer. TTP mRNA levels were extracted from an array dataset containing expression profiles for 251 human breast tumors. This dataset (GEO Acc# GSE3494) is described in Ref. and includes the Elston-Ellis pathological grade of each tumor (40) and patient mortality from recurrent breast cancer over the subsequent 13 years. A, TTP expression correlates negatively with breast tumor grade (r = −0.431, P = 1.1×10⁻¹²). Distribution plots are as described in Fig. 2 except that TTP mRNA is plotted as the ln of normalized array signal intensity. B, VEGF mRNA levels correlate negatively with TTP mRNA in breast tumors (r = − 0.281, P = 5.9×10⁻⁶). Black circles indicate grade I tumors, green circles grade II, red circles grade III, and open circles are undefined grade. Dotted lines indicate 95% confidence intervals of the regression solution. C, Kaplan-Meier analyses of patient cohorts ranked by tumor TTP mRNA expression. P values indicate cohort comparisons to patients expressing the highest TTP mRNA levels (black line).
Figure 6
Figure 6
A model for control of pro-oncogenic post-transcriptional gene regulatory networks by TTP. Features of the model are described in the Discussion. Potential TTP substrate mRNAs encoding factors promoting tumor progression were identified using the ARED database as described in Supplementary Table S5.

References

    1. Hanahan D, Weinberg RA. The hallmarks of cancer. Cell. 2000;100:57–70. - PubMed
    1. Chen CYA, Shyu AB. AU-rich elements: characterization and importance in mRNA degradation. Trends Biochem Sci. 1995;20:465–470. - PubMed
    1. Guhaniyogi J, Brewer G. Regulation of mRNA stability in mammalian cells. Gene. 2001;265:11–23. - PubMed
    1. Barreau C, Paillard L, Osborne HB. AU-rich elements and associated factors: are there unifying principles? Nucleic Acids Res. 2005;33:7138–7150. - PMC - PubMed
    1. Zhang T, Kruys V, Huez G, Gueydan C. AU-rich element-mediated translational control: complexity and multiple activities of trans-acting factors. Biochem Soc Trans. 2002;30:952–958. - PubMed

Publication types