. 2009 Jun 15;69(12):5030-8.
doi: 10.1158/0008-5472.CAN-08-4007. Epub 2009 Jun 2.

Loss of retinal cadherin facilitates mammary tumor progression and metastasis

Affiliations

Loss of retinal cadherin facilitates mammary tumor progression and metastasis

Georgia Agiostratidou et al. Cancer Res. .

Abstract

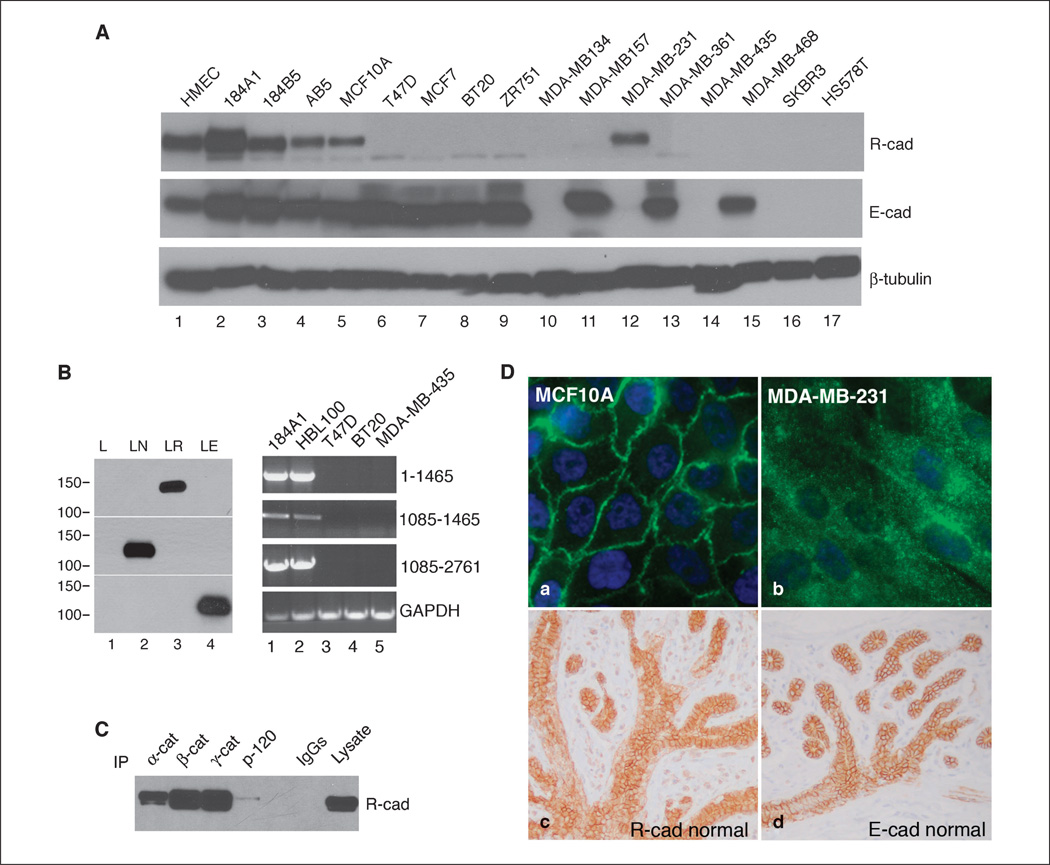
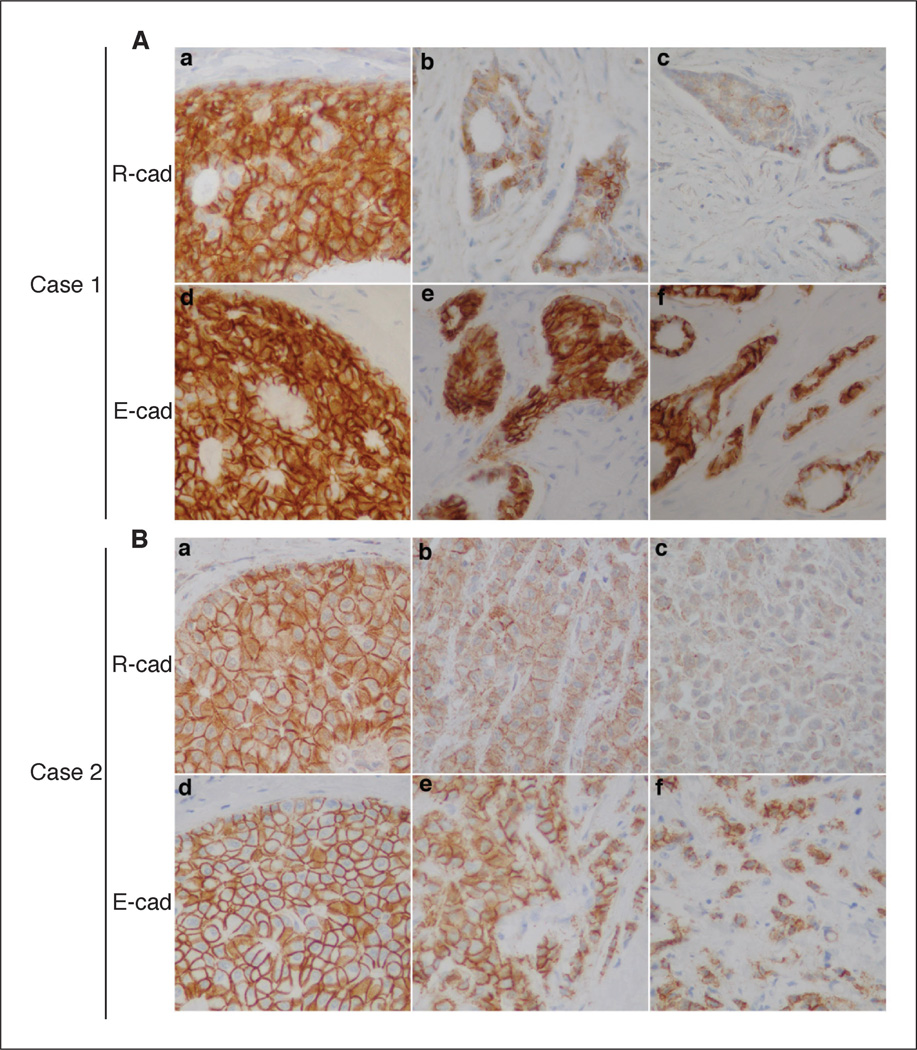
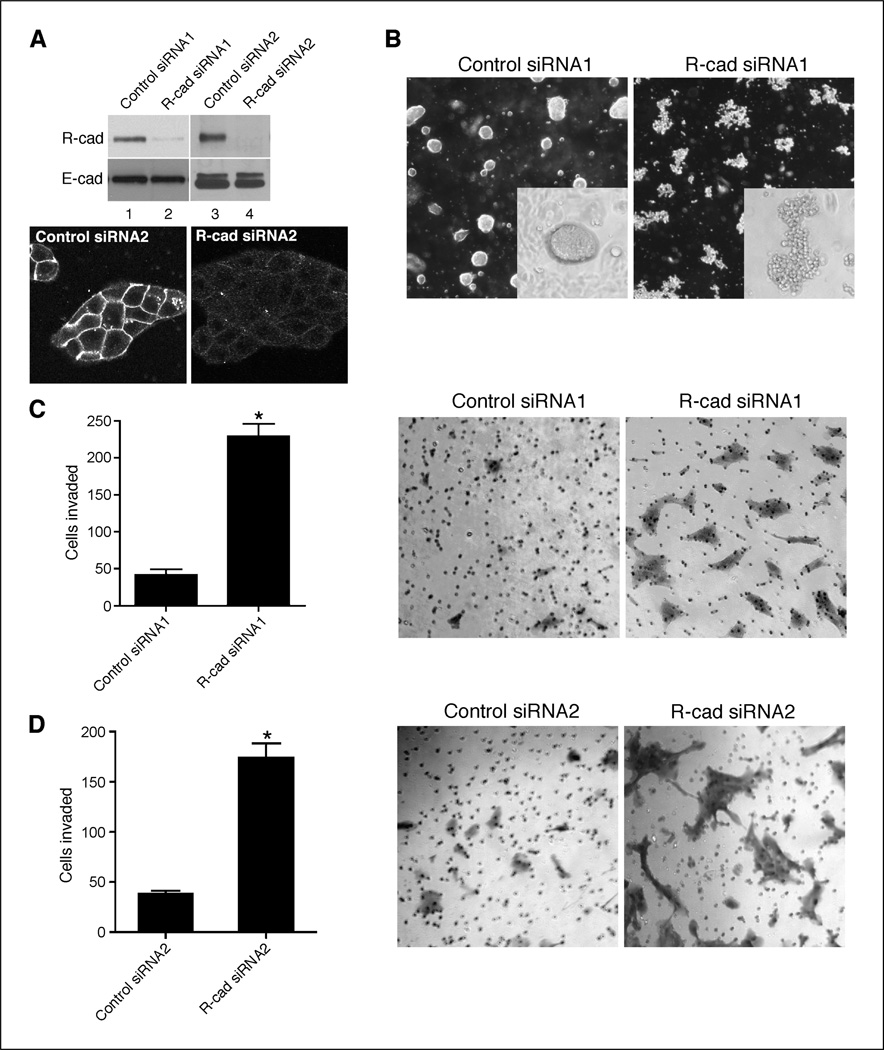
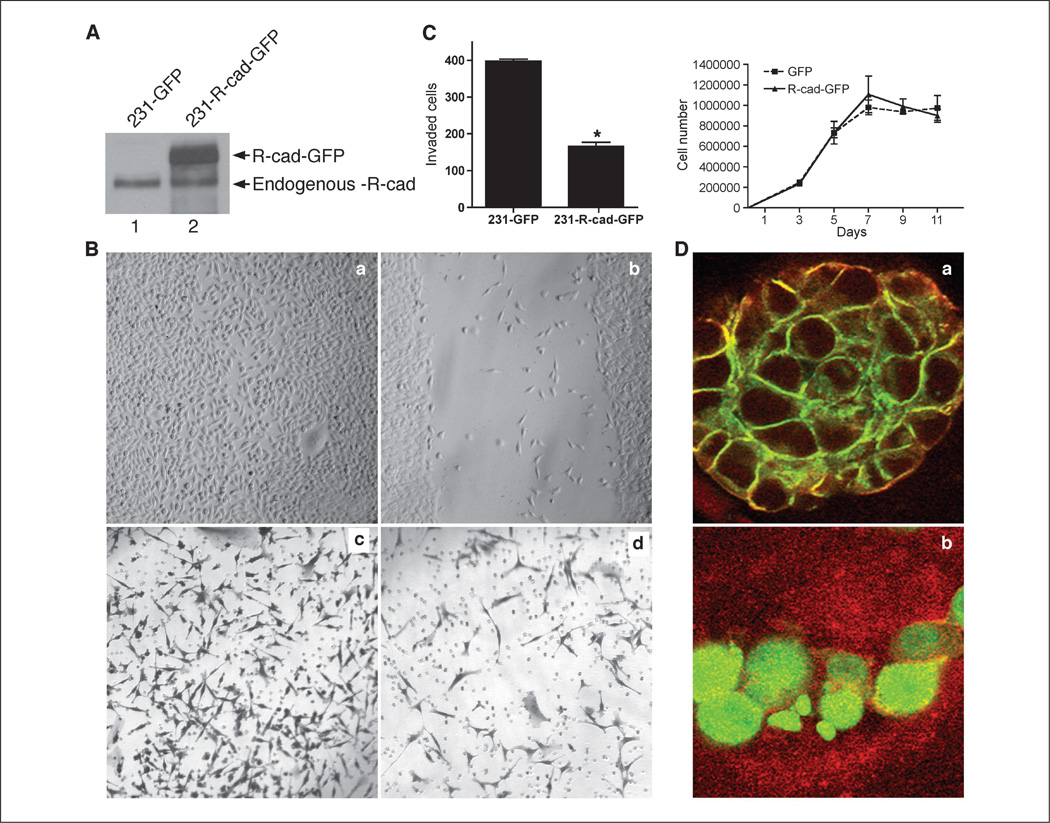
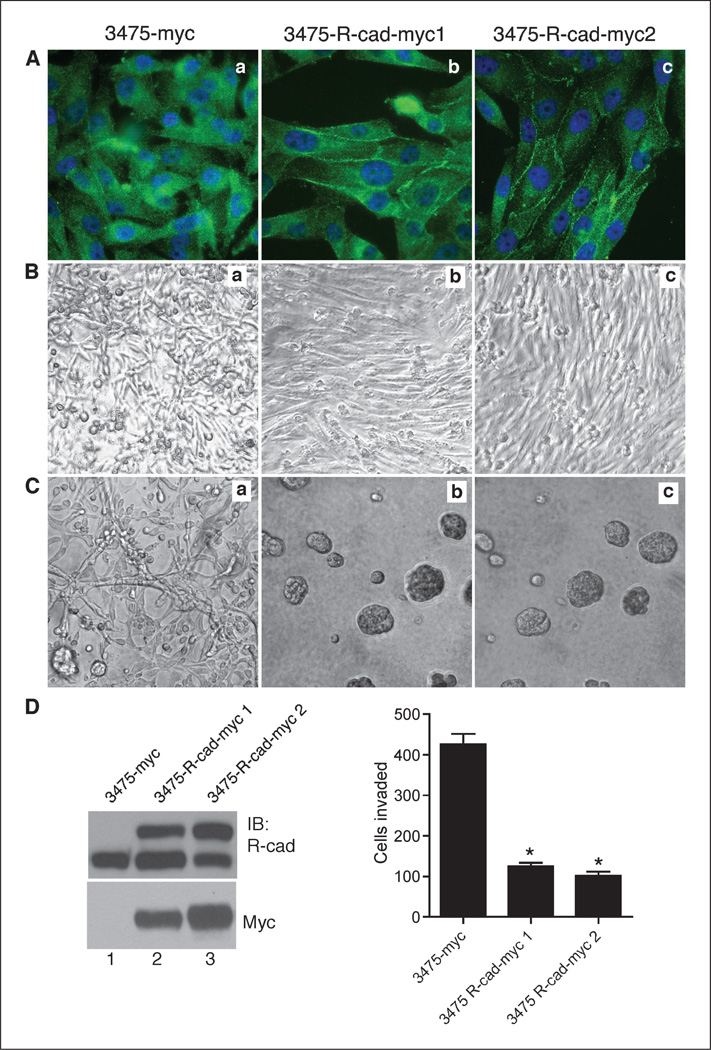
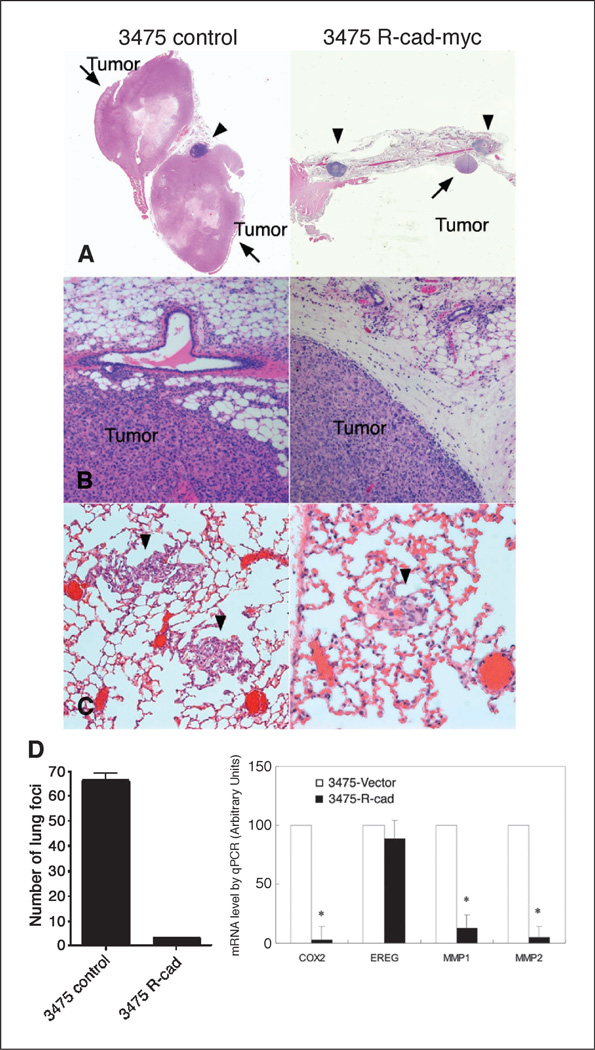
The mammary epithelium is thought to be stabilized by cell-cell adhesion mediated mainly by E-cadherin (E-cad). Here, we show that another cadherin, retinal cadherin (R-cad), is critical for maintenance of the epithelial phenotype. R-cad is expressed in nontransformed mammary epithelium but absent from tumorigenic cell lines. In vivo, R-cad was prominently expressed in the epithelium of both ducts and lobules. In human breast cancer, R-cad was down-regulated with tumor progression, with high expression in ductal carcinoma in situ and reduced expression in invasive duct carcinomas. By comparison, E-cad expression persisted in invasive breast tumors and cell lines where R-cad was lost. Consistent with these findings, R-cad knockdown in normal mammary epithelium stimulated invasiveness and disrupted formation of acini despite continued E-cad expression. Conversely, R-cad overexpression in aggressive cell lines induced glandular morphogenesis and inhibited invasiveness, tumor formation, and lung colonization. R-cad also suppressed the matrix metalloproteinase 1 (MMP1), MMP2, and cyclooxygenase 2 gene expression associated with pulmonary metastasis. The data suggest that R-cad is an adhesion molecule of the mammary epithelium, which acts as a critical regulator of the normal phenotype. As a result, R-cad loss contributes to epithelial suppression and metastatic progression.


Conflict of interest statement

Disclosure of Potential Conflicts of Interest

No potential conflicts of interest were disclosed.

Figures

Figure 1
Figure 1
R-cad is expressed in mammary epithelium and normal cell lines but is down-regulated in tumor cell lines. A, cell lysates from normal (lanes 1–5) and tumorigenic breast cell lines (lanes 6–17) were immunoblotted with antibodies against R-cad, E-cad, or β-tubulin. B, left, L cells transfected with control vector (lane 1), N-cad (lane 2), R-cad (lane 3), and E-cad (lane 4) were immunoblotted for R-cad, N-cad, or E-cad. Right, R-cad transcripts were examined by RT-PCR using RNA from R-cad–positive (lanes 1 and 2) and R-cad–negative (lanes 3–5) breast cell lines using three pairs of R-cad primers spanning the human R-cad mRNA sequence. C, lysates from MCF10A cells were immunoprecipitated with anti–α-catenin (lane 1), β-catenin (lane 2), γ-catenin (lane 3), and p120 (lane 4) and immunoblotted with anti–R-cad. Control IgGs were used (lane 5), and an MCF10A lysate was used as positive control (lane 6). D, MCF10A and MDA-MB-231 cells were stained with anti–R-cad followed by FITC secondary detection. Normal breast tissue was stained for R-cad (c) and E-cad (d). Note the crisp membrane staining of R-cad and E-cad in both the central ducts and surrounding lobular acini.
Figure 2
Figure 2
R-cad is expressed in DCIS and down-regulated in invasive ductal carcinoma of the breast. Archival breast tumors were analyzed by immunohistochemical staining for R-cad and E-cad. A and B, sections from formalin-fixed and paraffin-embedded IDCs that included areas of DCIS were immunostained with the ICOS anti–R-cad antibody. Crisp membranous staining for R-cad was detected in regions of DCIS (Aa, Ba) but diminished in regions of IDC (Ab, Bb), especially in poorly differentiated areas of the tumor (Ac, Bc). By comparison, E-cad staining was strong in all areas of these tumors.
Figure 3
Figure 3
R-cad knockdown in MCF10A cells disrupts morphogenesis and stimulates invasiveness. A, MCF10A were transfected with control siRNA (lanes 1 and 3) or two different R-cad siRNA1 and siRNA2 (lanes 2 and 4) for 48 h. Cell lysates were immunoblotted with an anti–R-cad or anti–E-cad antibody. B, control cells (left) or MCF10A knockdown cells (right) were plated onto collagen gels for spheroids evaluation. Each of the illustrated cell groups tested viable by DAPI nuclear staining (not shown). C and D, control (left) or MCF10A knockdowns (right) were applied onto 2-µg Matrigel-coated transwells for 18 h. Representative migrations of cells were counted and photographed. Columns, mean of duplicate experiments; bars, SE. *, P < 0.05.
Figure 4
Figure 4
R-cad overexpression in the MDA-MB-231 cell line suppresses migration and invasion and induces morphogenesis. A, lysates of MDA-231 expressing GFP (lane 1) or R-cad-GFP (lane 2) were immunoblotted with antibody to R-cad. A 125-kDa endogenous R-cad protein was detected in both cell lines (lanes 1 and 2) and a 140-kDda R-cad-GFP fusion protein was detected in infected cells (lane 2). B, GFP (a) or R-cad-GFP (b) expressing cells were grown to confluence on 35-mm Petri dishes and wounded using a sterile pipette. A representative from triplicate experiments. Invasiveness of the cells was tested in Bowden chambers. GFP (c) or MDA-MB-231/R-cad-GFP cells (d) were applied onto 20 Ag Matrigel-coated transwell filters for 24 h. C, left, the number of invading cells was counted in each well. Mean ± SE from five experiments. P < 0.05 (Mann-Whitney test). Right, GFP and R-cad-GFP expressing cells were plated at 1 × 10⁵ in six-well plates and counted at 0, 3, 5, 7, 9, and 11 d postplating. Mean ± SE from three experiments. D, MDA-231/Rcad-GFP cells (a) and GFP cells (b) were plated on Matrigel for 7 d, stained with an anti–ZO-1 antibody followed by TRITC detection, and imaged by confocal microscopy.
Figure 5
Figure 5
R-cad expression in MDA-MB-231 cells induces morphogenesis and suppresses invasion. A, the 3475 metastatic subline of MDA-231 was transfected with R-cad myc or myc vector and selected for R-cad expression by neomycin. Control cells (Aa) or R-cad-myc cells isolated from two independent transfections (Ab and Ac) were stained with anti–R-cad antibody followed by FITC-conjugated antibody. Note junctional localization of R-cad in 3475-R-cad cells (Ab, Ac) versus cytosolic endogenous R-cad in control cells (Aa). B and C, control (a) or R-cad-myc (b, c) cells were grown to confluence in two-dimensional (plastic dishes) or in three-dimensional (Matrigel) cultures for 7 d. D, left, cell extracts were immunoblotted with anti–R-cad or anti-Myc antibody. Right, 3475-R-cad cells were compared with controls in Matrigel invasion. Values of invading cells from five independent experiments. Columns, mean; bars, SE. *, P < 0.05.
Figure 6
Figure 6
R-cad suppresses tumor growth and lung colonization and inhibits the lung metastasis signature. A, control 3475 (left) or 3475-R-cad myc 1 cells (right) were injected bilaterally at 0.5 × 10⁶ mixed 1:1 with Matrigel into the mammary fat pads of athymic BALB/c females. At 8 to 12 wk later, 3475 control cells grew into large tumors whereas 3475-R-cad cells did not produce any tumors at that time. However, after 180 wk, 3475-R-cad cells grew into small nodules in the fat pad. Arrows point to tumor nodules, and arrowheads point to lymph nodes. B, 3475-myc tumors invaded readily the surrounding connective and fat tissue (left), whereas 3475-R-cad tumors had sharp demarcated margins (right). C and D, 1.0 × 10⁶ cells of control 3475-myc or 3475-R-cad myc 1 cells were injected into the tail vein of athymic BALB/c females. At 4 wk later, mice were sacrificed, and the number of lung foci, as in C, was quantified as mean ± SE; *, P < 0.05. D, right, RNA from control and 3475-R-cadmyc1 cells was reverse transcribed into cDNA. The level of mRNA for Cox-2, EREG, MMP1, and MMP2 were determined by qPCR and normalized to levels of β-actin mRNA. The mRNA levels for each of these genes from three experiments are displayed as mean ± SE. P < 0.05.

Similar articles

Cited by

References

    1. Bissell MJ, Radisky D. Putting tumours in context. Nat Rev Cancer. 2001;1:46–54. - PMC - PubMed
    1. Fraga MF, Herranz M, Espada J, et al. A mouse skin multistage carcinogenesis model reflects the aberrant DNA methylation patterns of human tumors. Cancer Res. 2004;64:5527–5534. - PubMed
    1. Bracke M, Roy FV, Mareel M. The E-cadherin/catenin complex in invasion and metastasis. In: Gunthert U, Birchmeier W, editors. Attempts to Understand Metastasis Formation I Metastasis-related molecules. Berlin: Springer; 1996. pp. 123–161.
    1. Christofori G, Semb H. The role of the cell-adhesion molecule E-cadherin as a tumour-suppressor gene. Trends Biochem Sci. 1999;24:73–76. - PubMed
    1. Vleminckx K, Vakaet L, Jr, Mareel M, Fiers W, van Roy F. Genetic manipulation of E-cadherin expression by epithelial tumor cells reveals an invasion suppressor role. Cell. 1991;66:107–119. - PubMed

Publication types