. 2009 Jun 15;69(12):5259-66.
doi: 10.1158/0008-5472.CAN-08-3444. Epub 2009 Jun 2.

White adipose tissue cells are recruited by experimental tumors and promote cancer progression in mouse models

Affiliations

White adipose tissue cells are recruited by experimental tumors and promote cancer progression in mouse models

Yan Zhang et al. Cancer Res. .

Abstract

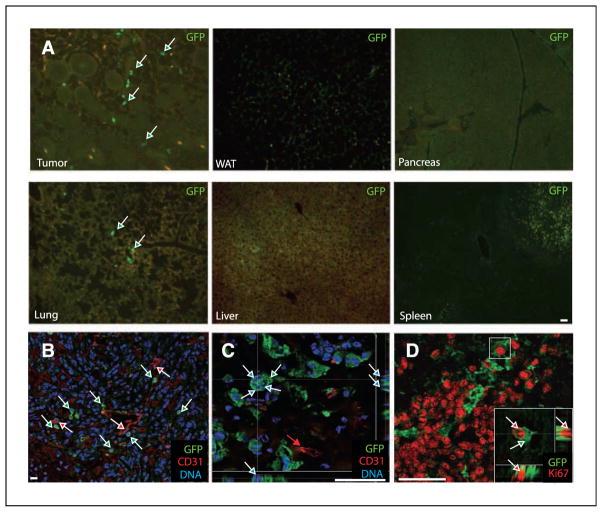
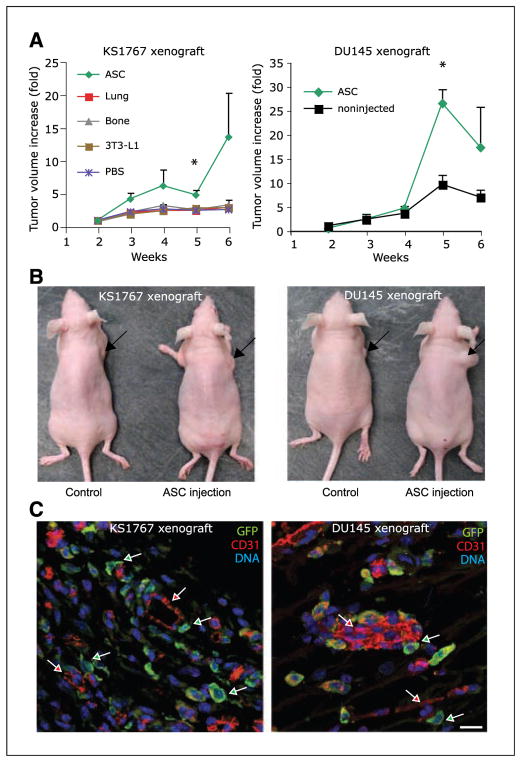
The connection between obesity and accelerated cancer progression has been established, but the mediating mechanisms are not well understood. We have shown that stromal cells from white adipose tissue (WAT) cooperate with the endothelium to promote blood vessel formation through the secretion of soluble trophic factors. Here, we hypothesize that WAT directly mediates cancer progression by serving as a source of cells that migrate to tumors and promote neovascularization. To test this hypothesis, we have evaluated the recruitment of WAT-derived cells by tumors and the effect of their engraftment on tumor growth by integrating a transgenic mouse strain engineered for expansion of traceable cells with established allograft and xenograft cancer models. Our studies show that entry of adipose stromal and endothelial cells into systemic circulation leads to their homing to and engraftment into tumor stroma and vasculature, respectively. We show that recruitment of adipose stromal cells by tumors is sufficient to promote tumor growth. Finally, we show that migration of stromal and vascular progenitor cells from WAT grafts to tumors is also associated with acceleration of cancer progression. These results provide a biological insight for the clinical association between obesity and cancer, thus outlining potential avenues for preventive and therapeutic strategies.


Conflict of interest statement

Disclosure of Potential Conflicts of Interest

No potential conflicts of interest were disclosed.

Figures

Figure 1
Figure 1
Adipose SVF cells home to tumors. A, 106 GFP+ SVF cells were i.v. injected into BALB/c mice carrying EF43. fgf4 tumors and let circulate for 1 d. B to D, 106 GFP+ SVF cells were i.v. injected into nude mice carrying MDA-231 (B) or KS1767 (C and D) xenografts and let to circulate for 7 d. In A to D, sections of tumors and control tissues were subjected to anti-GFP immunofluorescence (green arrows). Red counterstaining was performed with anti-CD31 antibodies (B and C) or anti-Ki67 antibodies (D)/secondary Cy3-conjugated antibodies (red), which were also used without the primary antibody to set the autofluorescence background (A). In B and C, DNA is stained blue with TOPRO3. D, inset, high magnification, reveals coexpression of GFP and Ki67. Z-stacks reveal GFP+ multinucleate (C, blue arrows) and proliferating (D, red arrows) cells. Scale bar, 100 μm.
Figure 2
Figure 2
Adipose SVF cells incorporate into tumor stroma and vasculature. GFP+ SVF cells (106) were i.v. injected into mice carrying KS1767 xenografts and let to circulate for 14 d. Tumor sections were subjected to anti-GFP (green) and anti-CD31 (A, red) or anti-αSMA (B, red) confocal immunofluorescence. Yellow signal on digital channel merging (right) reveals vascular donor GFP+/CD31+ cells (A) and perivascular GFP+/ctSMA+ cells (B). Insets, high magnification of selected areas. Nuclear Hoechst 33258 staining (blue) confirms cell being double-positive for GFP and CD31. Scale bar, 50 μm.
Figure 3
Figure 3
Tumor homing and engraftment of ASC and AEC. A, separation of freshly isolated GFP+ SVF cells into CD45CD34+CD31 (ASC) and CD45CD34+CD31+ (AEC). B, cultures of ASC (CD31) and AEC (CD31+) populations. C, two representative anti-GFP (green)/anti-CD31 (red) confocal immunofluorescence images of KS1767 xenografts from mice injected with 2.5 × 10⁵ of ASC (left) or AEC (right) 14 d before tumor recovery. Notice ASC being CD31 and some AEC being CD31+ (overlapping yellow signal). Z-stack projection of a median series through the TOPRO3+ (blue) nucleus confirms single-cell identity of GFP+CD31+ AEC. Bottom, separated GFP and CD31 channels. Scale bar, 10 μm.
Figure 4
Figure 4
S.c.-injected ASCs home to tumors via systemic circulation. Biodistribution of 106 GFP+ SVF cells in mice carrying KS1767 xenografts after administration i.v., s.c. proximately to the tumor, and s.c. distantly to the tumor. A, quantification of GFP+ cells in PBMC 360 min after distant s.c. injection by flow cytometry on PBMC compared with PBMC from an untreated mouse. B, time course of GFP+ cell circulation showing that the majority of adipose cells are present in the bloodstream at 15 to 360 min after s.c. injection. C, green, tumor sections 14 d after injection were subjected to anti-GFP immunofluorescence. Scale bar, 50 μm.
Figure 5
Figure 5
Tumor growth is promoted by ASC. Mice xenografted (at week 0) with KS1767 or DU145 tumors have been s.c. injected (lower back) starting 1 d after xenografting for 6 wk with 104 of the following mouse cells per day: Immorto/GFP ASC (n = 10), Immorto/GFP lung stromal cells (n = 5), Immorto/GFP bone stromal cells (n = 5), 3T3-L1 fibroblasts (n = 5), PBS (n = 5), or were noninjected (n = 5). A, tumor growth in mice injected with ASC compared with the indicated controls. Measured over time is the average fold increase of tumor size over the size measured at week 2. Points, mean; bars, SE. *, P < 0.05 (Student’s t test). B, representative ASC-treated and untreated mice at week 4. C, sections of tumors from representative ASC-treated mice at week 6 subjected to anti-GFP (green)/anti-CD31 (red) confocal immunofluorescence. Blue, nuclear TOPRO3 staining. Scale bar, 20 μm.
Figure 6
Figure 6
Cell recruitment from WAT is associated with tumor growth. A, representative mouse with a WAT implant (green arrow) 10 d after implantation. Right, section of WAT implant 30 d after implantation. B, growth of KS1767 and LLC tumors in mice with (green) or without (white) WAT implants. Points, mean between five mice per group; bars, SE. *, P < 0.1 (KS1767) and P < 0.05 (LLC; Student’s ttest). C, representative WAT-implanted and control mice at week 2. D, section of a KS1767 tumor from a WAT-implanted mouse subjected to anti-GFP (green)/anti-CD31 (red) immunofluorescence. Blue, nuclear Hoechst 33258 staining. Scale bar, 100 μm.

References

    1. Yach D, Stuckler D, Brownell KD. Epidemiologic and economic consequences of the global epidemics of obesity and diabetes. Nat Med. 2006;12:62–6. - PubMed
    1. Calle EE, Rodriguez C, Walker-Thurmond K, et al. Overweight, obesity, and mortality from cancer in a prospectively studied cohort of U.S. adults. N Engl J Med. 2003;348:1625–38. - PubMed
    1. Flegal KM, Graubard BI, Williamson DF, et al. Cause-specific excess deaths associated with underweight, overweight, and obesity. JAMA. 2007;298:2028–37. - PubMed
    1. Pierce J, Natarajan L, Caan BJ. Influence of a diet very high in vegetables, fruit, and fiber and low in fat on prognosis following treatment for breast cancer: the Women’s Healthy Eating and Living (WHEL) randomized trial. JAMA. 2007;298:289–98. - PMC - PubMed
    1. Rehman J, Considine RV, Bovenkerk JE, et al. Obesity is associated with increased levels of circulating hepatocyte growth factor. J Am Coll Cardiol. 2003;41:1408–13. - PubMed

Publication types

LinkOut - more resources