

Peroxisome proliferator-activated receptor-gamma agonist improves skeletal muscle insulin signaling in the pregestational intrauterine growth-restricted rat offspring
- PMID: 19491300
- PMCID: PMC2724105
- DOI: 10.1152/ajpendo.00008.2009
Peroxisome proliferator-activated receptor-gamma agonist improves skeletal muscle insulin signaling in the pregestational intrauterine growth-restricted rat offspring
Abstract
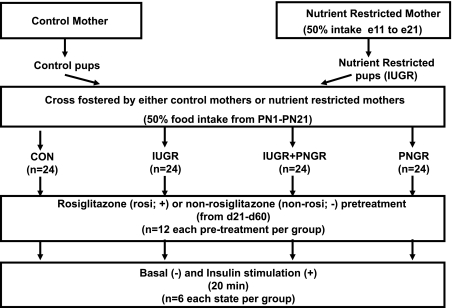
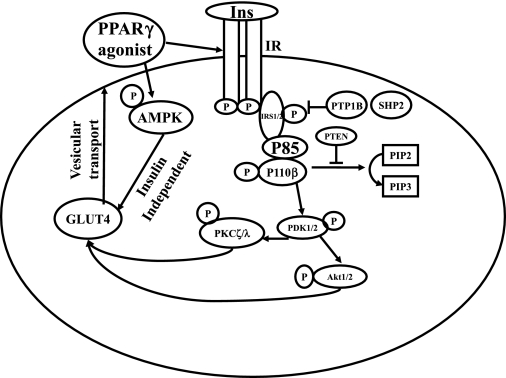
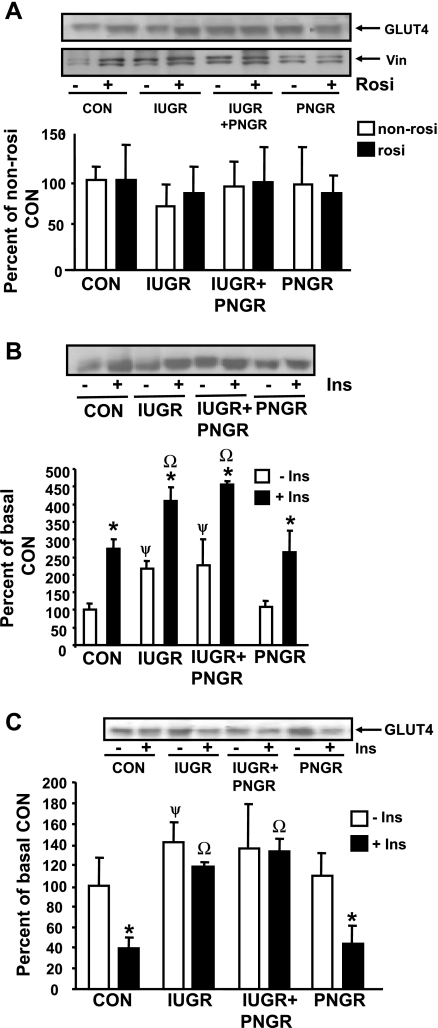
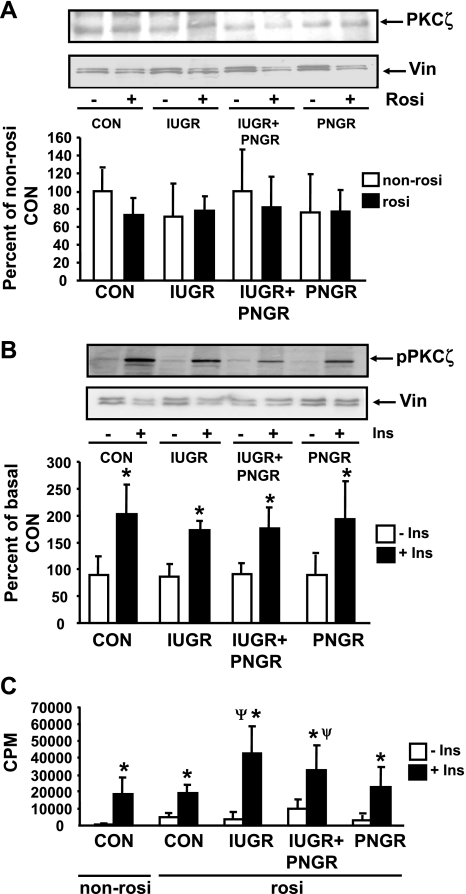
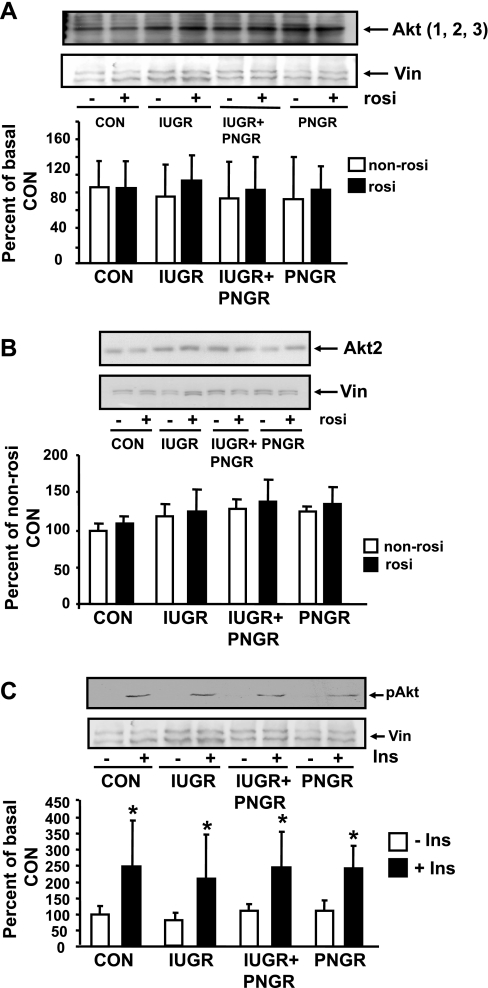
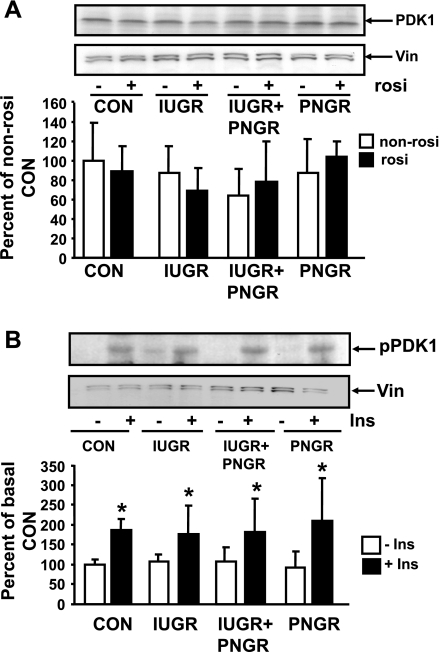
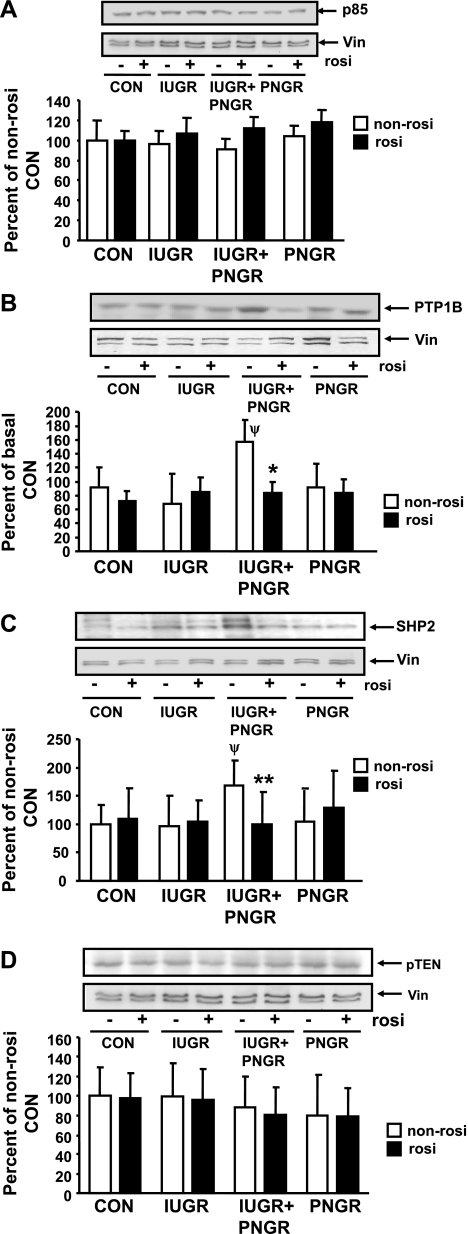
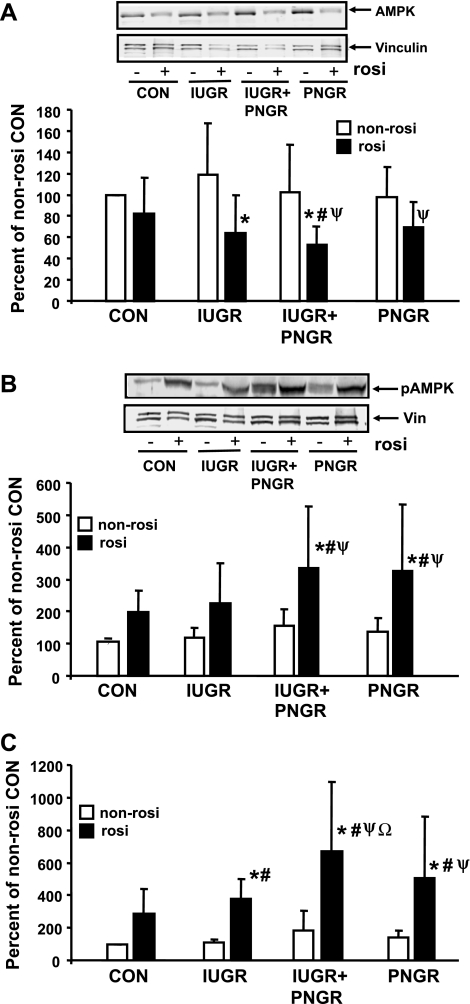
The effect of early intervention with a peroxisome proliferator-activated receptor-gamma (PPARgamma) agonist on skeletal muscle GLUT4 translocation and insulin signaling was examined in intrauterine (IUGR) and postnatal (PNGR) growth-restricted pregestational female rat offspring. Rosiglitazone [11 mumol/day provided from postnatal day (PN)21 to PN60] improved skeletal muscle insulin sensitivity and GLUT4 translocation in prenatal nutrient restriction [50% calories from embryonic day (e)11 to e21; IUGR] with (IUGR+PNGR) and without (IUGR) postnatal nutrient restriction (50% calories from PN1 to PN21; PNGR) similar to that of control (ad libitum feeds throughout; Con) (n = 6 each). This was accomplished by diminished basal and improved insulin-responsive GLUT4 association with the plasma membrane in IUGR, IUGR+PNGR, and PNGR mimicking that in Con (P < 0.005). While no change in p85-phosphatidylinositol 3-kinase (PI3-K) and phosphatase and tensin homolog deleted on chromosome 10 (PTEN) was observed, a decrease in protein tyrosine phosphatase 1B (PTP1B; P < 0.0002) and SH2-containing protein tyrosine phosphatase 2 (SHP2; P < 0.05) contributing to the rosiglitazone-induced insulin sensitivity was seen only in IUGR+PNGR. In contrast, an increase in phosphorylated 5'-adenosine monophosphate kinase (pAMPK; P < 0.04) and insulin responsiveness of phosphorylated phosphoinositide-dependent protein kinase-1 (pPDK1; P < 0.05), pAkt (P < 0.01), and particularly pPKCzeta (P < 0.0001) and its corresponding enzyme activity (P < 0.005) were observed in all four experimental groups. We conclude that early introduction of PPARgamma agonist improved skeletal muscle activation of AMPK and insulin signaling, resulting in insulin-independent AMPK and insulin-responsive GLUT4 association with plasma membranes in IUGR, IUGR+PNGR, and PNGR adult offspring, similar to that of Con. These findings support a role for insulin sensitizers in preventing the subsequent development of gestational or type 2 diabetes mellitus in intrauterine and postnatal growth-restricted offspring.
Figures
Similar articles
-
Early exposure of the pregestational intrauterine and postnatal growth-restricted female offspring to a peroxisome proliferator-activated receptor-{gamma} agonist.Am J Physiol Endocrinol Metab. 2010 Mar;298(3):E489-98. doi: 10.1152/ajpendo.00361.2009. Epub 2009 Dec 15. Am J Physiol Endocrinol Metab. 2010. PMID: 20009032 Free PMC article.
-
Early exercise regimen improves insulin sensitivity in the intrauterine growth-restricted adult female rat offspring.Am J Physiol Endocrinol Metab. 2009 Feb;296(2):E272-81. doi: 10.1152/ajpendo.90473.2008. Epub 2008 Nov 11. Am J Physiol Endocrinol Metab. 2009. PMID: 19001551 Free PMC article.
-
Myocardial macronutrient transporter adaptations in the adult pregestational female intrauterine and postnatal growth-restricted offspring.Am J Physiol Endocrinol Metab. 2012 Jun 1;302(11):E1352-62. doi: 10.1152/ajpendo.00539.2011. Epub 2012 Feb 14. Am J Physiol Endocrinol Metab. 2012. PMID: 22338075 Free PMC article.
-
Developmental programming in response to intrauterine growth restriction impairs myoblast function and skeletal muscle metabolism.J Pregnancy. 2012;2012:631038. doi: 10.1155/2012/631038. Epub 2012 Jul 31. J Pregnancy. 2012. PMID: 22900186 Free PMC article. Review.
-
Maternal Nutrient Restriction and Skeletal Muscle Development: Consequences for Postnatal Health.Adv Exp Med Biol. 2020;1265:153-165. doi: 10.1007/978-3-030-45328-2_9. Adv Exp Med Biol. 2020. PMID: 32761575 Review.
Cited by
-
Growth hormone, insulin-like growth factor 1, and insulin signaling-a pharmacological target in body wasting and cachexia.J Cachexia Sarcopenia Muscle. 2011 Dec;2(4):191-200. doi: 10.1007/s13539-011-0043-5. Epub 2011 Oct 20. J Cachexia Sarcopenia Muscle. 2011. PMID: 22207907 Free PMC article.
-
Pre-germinated brown rice prevents high-fat diet induced hyperglycemia through elevated insulin secretion and glucose metabolism pathway in C57BL/6J strain mice.J Clin Biochem Nutr. 2015 Jan;56(1):28-34. doi: 10.3164/jcbn.14-50. Epub 2014 Nov 28. J Clin Biochem Nutr. 2015. PMID: 25834303 Free PMC article.
-
Intrauterine Growth Restriction: Hungry for an Answer.Physiology (Bethesda). 2016 Mar;31(2):131-46. doi: 10.1152/physiol.00033.2015. Physiology (Bethesda). 2016. PMID: 26889018 Free PMC article. Review.
-
Peroxisome Proliferator-Activated Receptor -β/δ, -γ Agonists and Resveratrol Modulate Hypoxia Induced Changes in Nuclear Receptor Activators of Muscle Oxidative Metabolism.PPAR Res. 2010;2010:129173. doi: 10.1155/2010/129173. Epub 2010 Nov 24. PPAR Res. 2010. PMID: 21113404 Free PMC article.
-
Early exposure of the pregestational intrauterine and postnatal growth-restricted female offspring to a peroxisome proliferator-activated receptor-{gamma} agonist.Am J Physiol Endocrinol Metab. 2010 Mar;298(3):E489-98. doi: 10.1152/ajpendo.00361.2009. Epub 2009 Dec 15. Am J Physiol Endocrinol Metab. 2010. PMID: 20009032 Free PMC article.
References
-
- Aerts L, Holemans K, Van Assche FA. Maternal diabetes during pregnancy: consequences for the offspring. Diabetes Metab Rev 6: 147–167, 1990. - PubMed
-
- Aronoff S, Rosenblatt S, Braithwaite S, Egan JW, Mathisen AL, Schneider RL. Pioglitazone hydrochloride monotherapy improves glycemic control in the treatment of patients with type 2 diabetes: a 6-month randomized placebo-controlled dose-response study. The Pioglitazone 001 Study Group. Diabetes Care 23: 1605–1611, 2000. - PubMed
-
- Barker DJ, Osmond C, Forsen TJ, Kajantie E, Eriksson JG. Trajectories of growth among children who have coronary events as adults. N Engl J Med 353: 1802–1809, 2005. - PubMed
Publication types
MeSH terms
Substances
Grants and funding
LinkOut - more resources
Full Text Sources
Medical
Research Materials
Miscellaneous