

Gene and protein expression pilot profiling and biomarkers in an experimental mouse model of hypertensive glaucoma
- PMID: 19491369
- PMCID: PMC3697862
- DOI: 10.3181/0811-RM-344
Gene and protein expression pilot profiling and biomarkers in an experimental mouse model of hypertensive glaucoma
Abstract
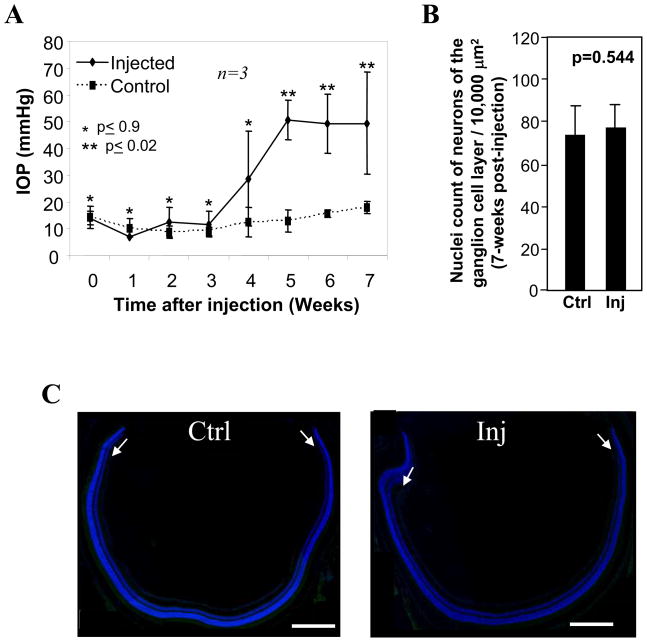
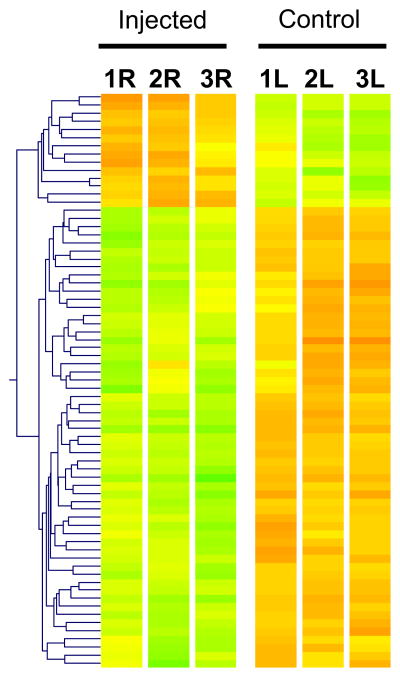
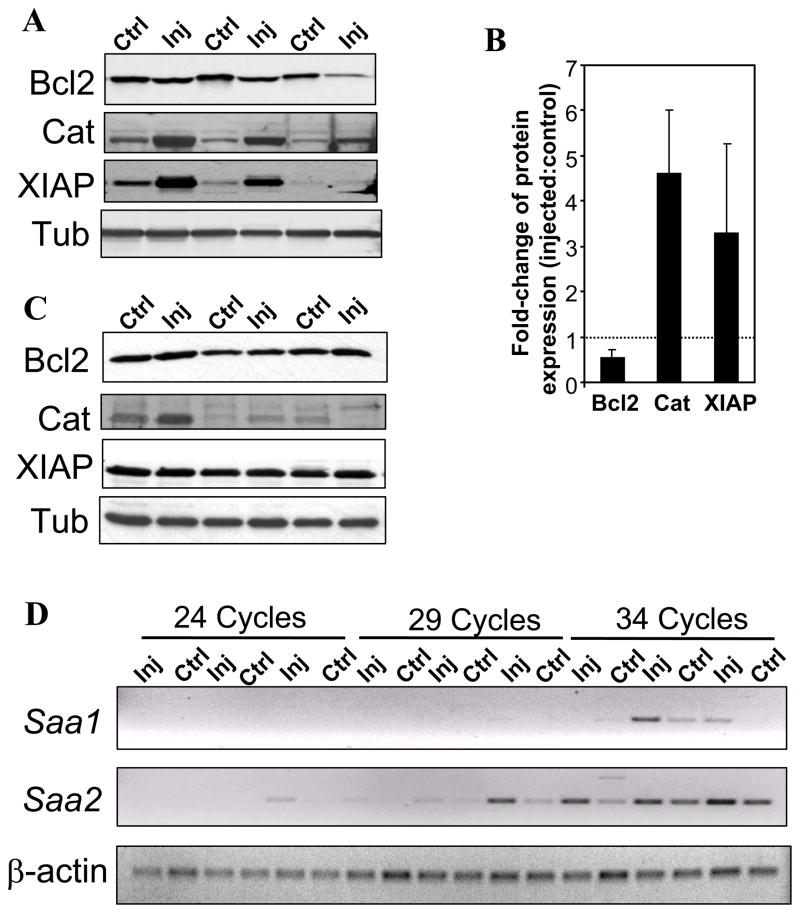
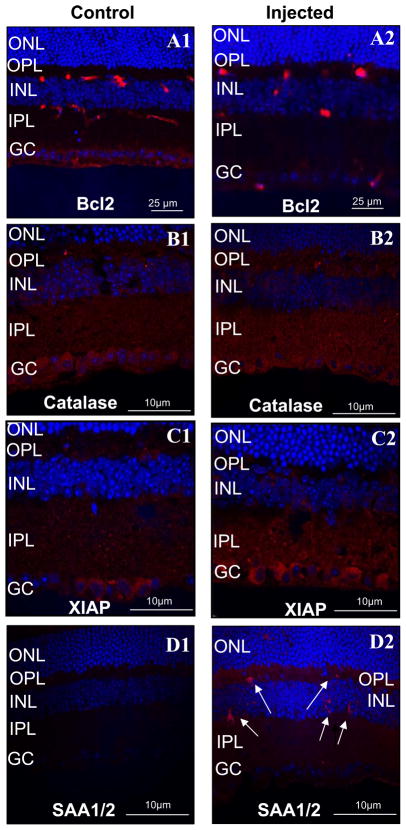
Glaucoma is a group of genetically heterogeneous neurodegenerative disorders causing the degeneration of the ganglion neurons of the retina. Increased intraocular pressure (IOP) is a hallmark risk factor promoting the death of ganglion neurons of the retina in glaucoma. Yet, the molecular processes underlying the degeneration of these neurons by increased IOP are not understood. To gain insight into the early molecular events and discover biomarkers induced by IOP, we performed gene and protein expression profiling to compare retinas of eyes with and without high IOP in a rodent model of experimental glaucoma. This pilot study found that the IOP-mediated changes in the transcription levels of a restricted set of genes implicated in peroxisomal and mitochondrial function, modulation of neuron survival and inflammatory processes, were also accompanied by changes in the levels of proteins encoded by the same genes. With the exception of the inflammatory markers, serum amyloid-A1 (SAA1) and serum amyloid-A2 (SAA2), the IOP-induced changes in protein expression were restricted to ganglion neurons of the retina and they were detected also in the vitreous, thus suggesting an early IOP-mediated loss of ganglion cell integrity. Interestingly, SAA1 and SAA2 were induced in retinal microglia cells, whereas they were reduced in sera of IOP-responsive mice. Hence, this study defines novel IOP-induced molecular processes, biomarkers and sources thereof, and it further validates the extension of the analyses herein reported to other genes modulated by IOP.
Figures

Similar articles
-
Retinal gene profiling in a hereditary rodent model of elevated intraocular pressure.Mol Vis. 2006 Oct 18;12:1199-210. Mol Vis. 2006. PMID: 17102796
-
The elevation of intraocular pressure is associated with apoptosis and increased immunoreactivity for nitric oxide synthase in rat retina whereas the effectiveness of retina derived relaxing factor is unaffected.Exp Eye Res. 2016 Apr;145:401-411. doi: 10.1016/j.exer.2016.03.002. Epub 2016 Mar 4. Exp Eye Res. 2016. PMID: 26948455
-
IOP induces upregulation of GFAP and MHC-II and microglia reactivity in mice retina contralateral to experimental glaucoma.J Neuroinflammation. 2012 May 14;9:92. doi: 10.1186/1742-2094-9-92. J Neuroinflammation. 2012. PMID: 22583833 Free PMC article.
-
Understanding glaucomatous damage: anatomical and functional data from ocular hypertensive rodent retinas.Prog Retin Eye Res. 2012 Jan;31(1):1-27. doi: 10.1016/j.preteyeres.2011.08.001. Epub 2011 Sep 21. Prog Retin Eye Res. 2012. PMID: 21946033 Review.
-
[The use of mice in glaucoma research --to clarify the mechanism of intraocular pressure regulation and retinal ganglion cell damage].Nippon Ganka Gakkai Zasshi. 2010 Mar;114(3):217-46; discussion 247. Nippon Ganka Gakkai Zasshi. 2010. PMID: 20387537 Review. Japanese.
Cited by
-
Autophagy in the Aging and Experimental Ocular Hypertensive Mouse Model.Invest Ophthalmol Vis Sci. 2020 Aug 3;61(10):31. doi: 10.1167/iovs.61.10.31. Invest Ophthalmol Vis Sci. 2020. PMID: 32797200 Free PMC article.
-
Modeling glaucoma in rats by sclerosing aqueous outflow pathways to elevate intraocular pressure.Exp Eye Res. 2015 Dec;141:23-32. doi: 10.1016/j.exer.2015.05.012. Epub 2015 May 21. Exp Eye Res. 2015. PMID: 26003399 Free PMC article. Review.
-
Early gene expression changes in the retinal ganglion cell layer of a rat glaucoma model.Invest Ophthalmol Vis Sci. 2011 Mar 18;52(3):1460-73. doi: 10.1167/iovs.10-5930. Print 2011 Mar. Invest Ophthalmol Vis Sci. 2011. PMID: 21051717 Free PMC article.
-
Transcriptomic profiles of retinal ganglion cells are defined by the magnitude of intraocular pressure elevation in adult mice.Sci Rep. 2019 Feb 22;9(1):2594. doi: 10.1038/s41598-019-39141-1. Sci Rep. 2019. PMID: 30796289 Free PMC article.
-
Differential gene expression in glaucoma.Cold Spring Harb Perspect Med. 2014 Jul 1;4(7):a020636. doi: 10.1101/cshperspect.a020636. Cold Spring Harb Perspect Med. 2014. PMID: 24985133 Free PMC article. Review.
References
-
- Quigley HA. Neuronal death in glaucoma. Prog Retin Eye Res. 1999;18:39–57. - PubMed
-
- Wax MB, Tezel G. Neurobiology of glaucomatous optic neuropathy: diverse cellular events in neurodegeneration and neuroprotection. Mol Neurobiol. 2002;26:45–55. - PubMed
-
- Lee WR, Grierson I. Relationships between intraocular pressure and the morphology of the outflow apparatus. Transactions of the ophthalmological societies of the United Kingdom. 1974;94:430–449. - PubMed
Publication types
MeSH terms
Substances
Grants and funding
LinkOut - more resources
Full Text Sources
Medical
Miscellaneous