. 2009 Jul 30;114(5):983-94.
doi: 10.1182/blood-2009-03-207944. Epub 2009 Jun 2.

Graded repression of PU.1/Sfpi1 gene transcription by GATA factors regulates hematopoietic cell fate

Affiliations

Graded repression of PU.1/Sfpi1 gene transcription by GATA factors regulates hematopoietic cell fate

Stella T Chou et al. Blood. .

Abstract

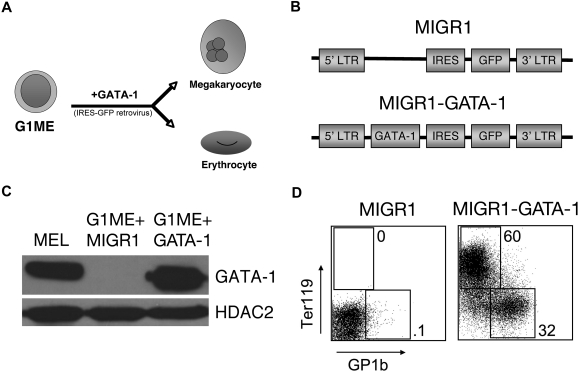
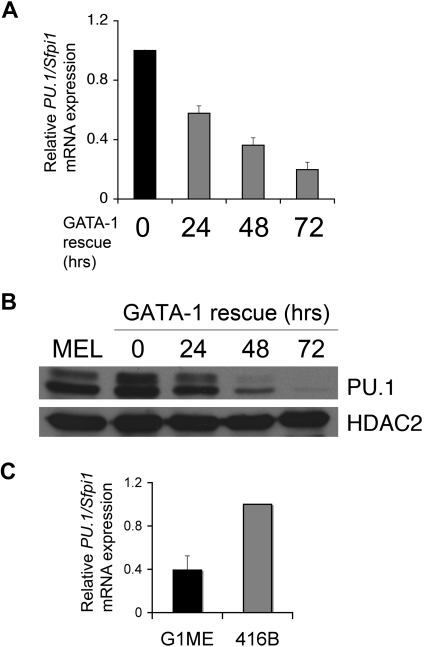
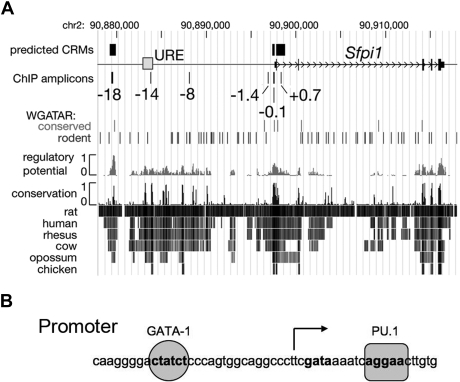
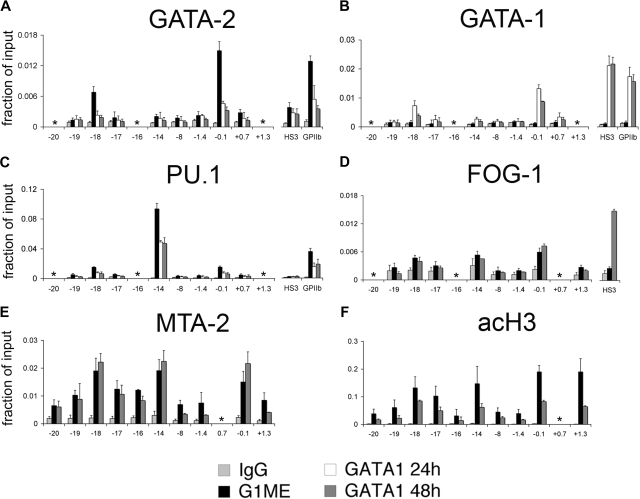
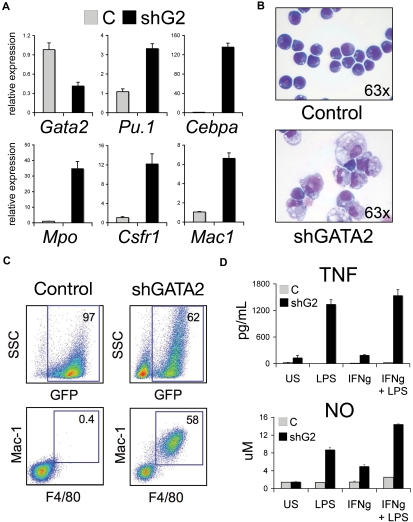
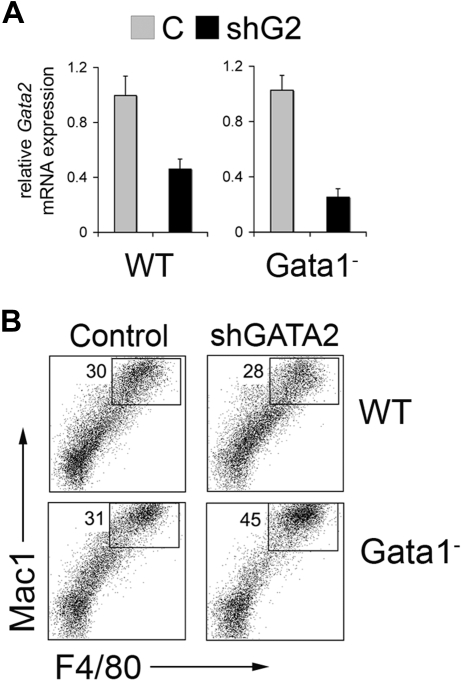
GATA-1 and PU.1 are essential hematopoietic transcription factors that control erythromegakaryocytic and myelolymphoid differentiation, respectively. These proteins antagonize each other through direct physical interaction to repress alternate lineage programs. We used immortalized Gata1(-) erythromegakaryocytic progenitor cells to study how PU.1/Sfpi1 expression is regulated by GATA-1 and GATA-2, a related factor that is normally expressed at earlier stages of hematopoiesis. Both GATA factors bind the PU.1/Sfpi1 gene at 2 highly conserved regions. In the absence of GATA-1, GATA-2 binding is associated with an undifferentiated state, intermediate level PU.1/Sfpi1 expression, and low-level expression of its downstream myeloid target genes. Restoration of GATA-1 function induces erythromegakaryocytic differentiation. Concomitantly, GATA-1 replaces GATA-2 at the PU.1/Sfpi1 locus and PU.1/Sfpi1 expression is extinguished. In contrast, when GATA-1 is not present, shRNA knockdown of GATA-2 increases PU.1/Sfpi1 expression by 3-fold and reprograms the cells to become macrophages. Our findings indicate that GATA factors act sequentially to regulate lineage determination during hematopoiesis, in part by exerting variable repressive effects at the PU.1/Sfpi1 locus.


Figures

Figure 1
Figure 1
GATA-1 induces erythroid and megakaryocytic differentiation in G1ME cells. (A) Schematic of G1ME cell differentiation into megakaryocytes and erythrocytes after GATA-1 is retrovirally restored. (B) Retroviral constructs used for gene rescue. The MIGR1 vector encodes green fluorescent protein (GFP) linked to an internal ribosome entry site (IRES). MIGR1-GATA-1 also contains the full-length coding region of the murine GATA-1 cDNA. (C) GATA-1 protein expression in transduced G1ME cells determined by Western blotting. GATA-1 expression in transduced G1ME cells approximated endogenous expression in murine erythroleukemia (MEL) cells. (D) Expression of the erythroid-specific marker Ter119 and terminal megakaryocytic marker GP1b of G1ME cells 4 days after transduction with MIGR1 or MIGR1-GATA-1. Percentages refer to fraction of GFP+ cells expressing Ter119 or GP1b.
Figure 2
Figure 2
GATA-1 inhibits PU.1 expression. (A) PU.1/Sfpi1 mRNA expression by real-time reverse-transcribed polymerase chain reaction (RT-PCR) after GATA-1 rescue in G1ME cells relative to untransduced cells. Bars represent the mean of 3 independent experiments ± SD. (B) PU.1 protein expression by Western blotting of sorted GFP+ G1ME cells before and after GATA-1 restoration. PU.1 expression in untransduced G1ME cells approximates endogenous murine erythroleukemia (MEL) cells. Two bands are visualized for PU.1, most likely due to posttranslational modifications. HDAC2 indicates histone deacetylase 2. (C) PU.1/Sfpi1 mRNA expression by RT-PCR in G1ME cells relative to the myeloid cell line 416B. Bars represent the mean of 3 independent experiments ± SD.
Figure 3
Figure 3
Repression of PU.1 targets by GATA-1 in G1ME cells. The columns represent triplicate MIGR1 or MIGR1-GATA-1 transduced G1ME cells sorted by GFP positivity 42 hours after infection. The color scale ranges from green to red, corresponding to decreases and increases, respectively, in expression level. Transcripts shown are a cohort of PU.1 targets, with approximately two-thirds down-regulated by GATA-1 restoration.
Figure 4
Figure 4
The Sfpi1/PU.1 locus. (A) A 35-kb segment of mouse chromosome 2 is represented with the DNA encoding Sfpi1/PU.1 (thin black rectangles), the transcription start site (open arrow), and the −14-kb upstream regulatory element (URE) as a gray box. Predicted erythroid cis-regulatory modules (CRMs) and amplicons used in chromatin immunoprecipitation (ChIP) assays are shown as rectangles above and below the line, respectively, with the positions of the amplicons relative to the transcription start given in kilobases. The positions of GATA consensus binding motifs (WGATAR), both conserved in mammals and present only in rodents, are indicated as vertical lines. The track labeled “regulatory potential” plots sequence similarity to alignment patterns in known regulatory regions. Rows labeled “conservation” show interspecies alignments with the mouse genome; darker lines indicate greater sequence similarity. (B) The sequence of the PU.1/Sfpi1 promoter region. A PU.1 binding site (AGGAA) is located just downstream of the transcription start site, which is indicated by the arrow. A GATA-1 binding site (CTATCT) is located 27-bp upstream of the PU.1 binding site.
Figure 5
Figure 5
Quantitative chromatin immunoprecipitation (ChIP) analysis of the PU.1/Sfpi1 locus in G1ME cells untransduced, or transduced with MIGR1-GATA-1, examined at 24 hours and 48 hours after infection. The relative occupancy of GATA-2 (A), GATA-1 (B), PU.1 (C), Friend of GATA-1 (FOG-1, D), metastasis associated protein-2 (MTA-2, E), and acetylase H3 (acH3, F) are indicated as vertical bars. As a negative control, ChIP experiments were performed with isotype-matched preimmune IgG. The hypersensitivity 3 (HS3) region of the β-globin locus and GPIIb promoter region are controls. * denotes not done. The results represent the average of 3 independent ChIP experiments. Error bars represent SD.
Figure 6
Figure 6
GATA-2 deficiency induces PU-1/Sfpi1 and reprograms G1ME cells to macrophages. (A) Relative expression of Gata2 and selected myeloid and macrophage-specific target genes in G1ME cells transduced with Banshee control (C) or Banshee shGATA2 retrovirus and flow-purified by GFP positivity. Mean plus or minus standard deviation values are shown for one representative experiment performed in triplicate. CCAAT/enhancer binding protein alpha (Cebpa), myeloperoxidase (Mpo), colony-stimulating factor receptor 1 (Csfr1), and macrophage 1 (Mac1). (B) Morphology of G1ME cells transduced with control or shGATA2 virus 6 days after infection. The shG2-infected cells are larger with abundant cytoplasm-containing granules and vacuoles. May-Grünwald Giemsa stain. Original magnification, ×63. Photographs were obtained using an Axioskope 2 microscope equipped with an AxioCam camera and AxioVision acquisition software (Carl Zeiss Microimaging) at room temperature. (C) Representative flow cytometric analysis of Banshee control– and Banshee shGATA2–infected G1ME cells. The numbers indicate the percentage of GFP+ cells within the live population in the top panels and the percentage of Mac-1+ F4/80+ within the GFP+ population in the bottom panels. (D) Macrophage stimulation assays of Banshee control (C)– and Banshee shGATA2–transduced G1ME cells. Tumor necrosis factor (TNF) and nitric oxide (NO) levels were measured from the supernatant of unstimulated (US) cells or 18 hours after stimulation with 100 ng/mL lipopolysaccharide (LPS) and/or interferon-γ (IFN-γ). GATA-2 knockdown G1ME cells induced TNF secretion and produced nitric oxide at baseline and after stimulation with LPS and IFN-γ. Mean ± SD values are shown for one representative experiment performed in triplicate.
Figure 7
Figure 7
Gata2 knockdown in wild-type (WT) and Gata1 cells derived from in vitro differentiation of embryonic stem (ES) cells. (A) Five-day-old embryoid bodies were disrupted and the cells were transduced with Banshee control (C) or Banshee shGATA2 retrovirus. Twenty-four hours later, GFP+ cells were purified by flow cytometry and analyzed for Gata2 expression by RT-PCR. Gata2 mRNA expression normalized to Gapdh mRNA is assigned a value of 1.0 in control virus–infected cells from WT and Gata1 embryoid bodies. Error bars represent SD. (B) Representative flow cytometric analysis of Banshee control– and Banshee shGATA2–infected wild-type (WT) and Gata1 hematopoietic progenitors derived from embryoid bodies. The numbers indicate the percentage of high Mac-1+ F4/80+ cells within the GFP+ population.

References

    1. Laiosa CV, Stadtfeld M, Graf T. Determinants of lymphoid-myeloid lineage diversification. Annu Rev Immunol. 2006;24:705–738. - PubMed
    1. Cantor AB, Orkin SH. Hematopoietic development: a balancing act. Curr Opin Genet Dev. 2001;11:513–519. - PubMed
    1. Kim SI, Bresnick EH. Transcriptional control of erythropoiesis: emerging mechanisms and principles. Oncogene. 2007;26:6777–6794. - PubMed
    1. Iwasaki H, Akashi K. Myeloid lineage commitment from the hematopoietic stem cell. Immunity. 2007;26:726–740. - PubMed
    1. Nutt SL, Kee BL. The transcriptional regulation of B cell lineage commitment. Immunity. 2007;26:715–725. - PubMed

Publication types

MeSH terms

Associated data