. 2009 Jul 31;284(31):20738-52.
doi: 10.1074/jbc.M109.021766. Epub 2009 Jun 2.

Combinatorial transcription factor regulation of the cyclic AMP-response element on the Pgc-1alpha promoter in white 3T3-L1 and brown HIB-1B preadipocytes

Affiliations

Combinatorial transcription factor regulation of the cyclic AMP-response element on the Pgc-1alpha promoter in white 3T3-L1 and brown HIB-1B preadipocytes

Angeliki Karamitri et al. J Biol Chem. .

Abstract

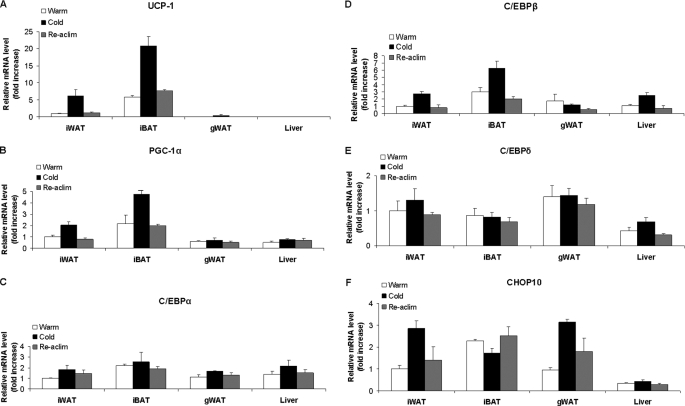
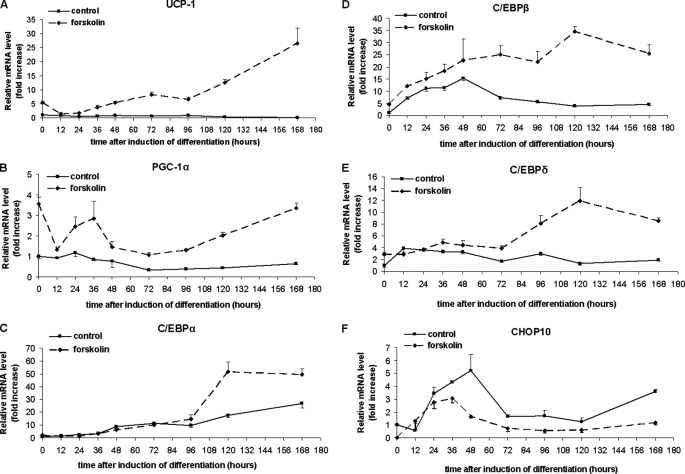
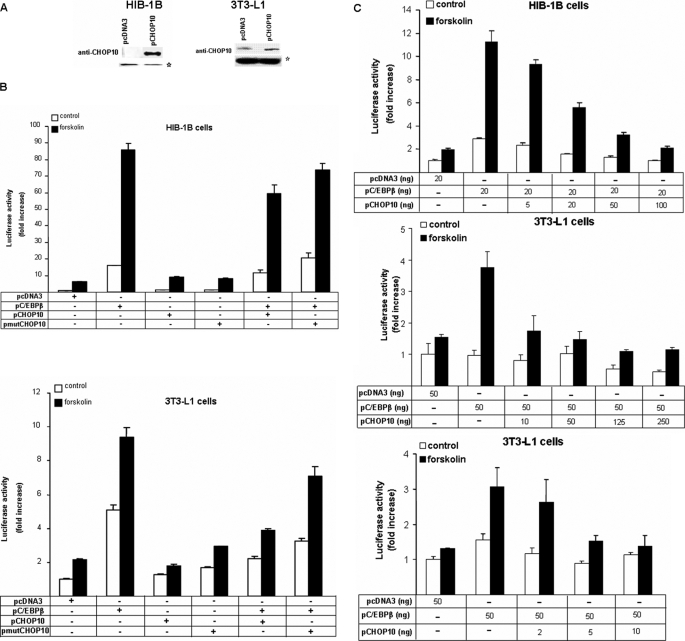
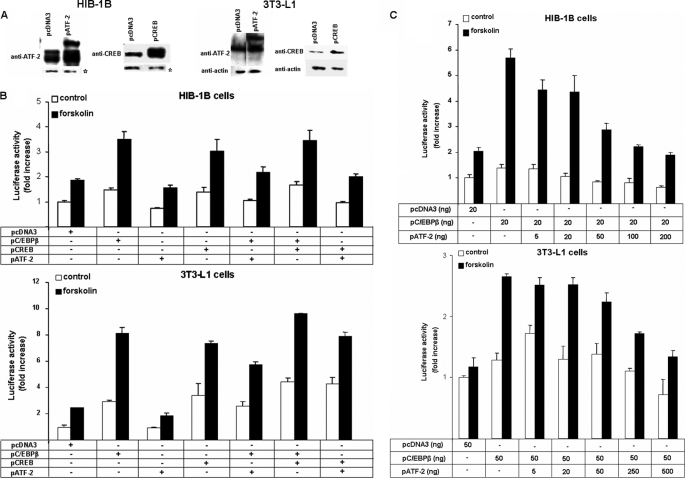
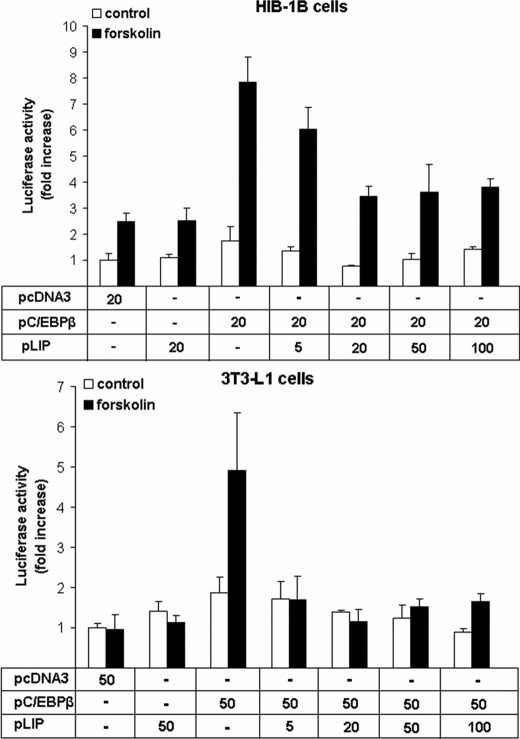
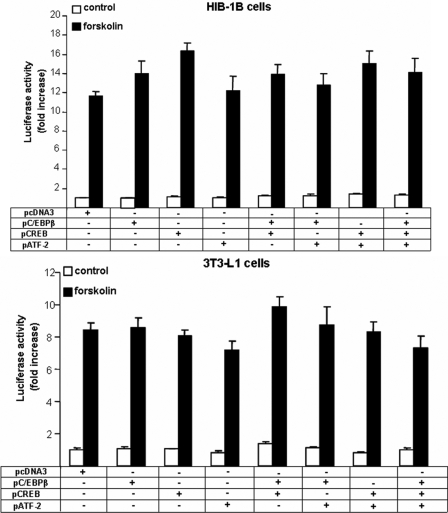
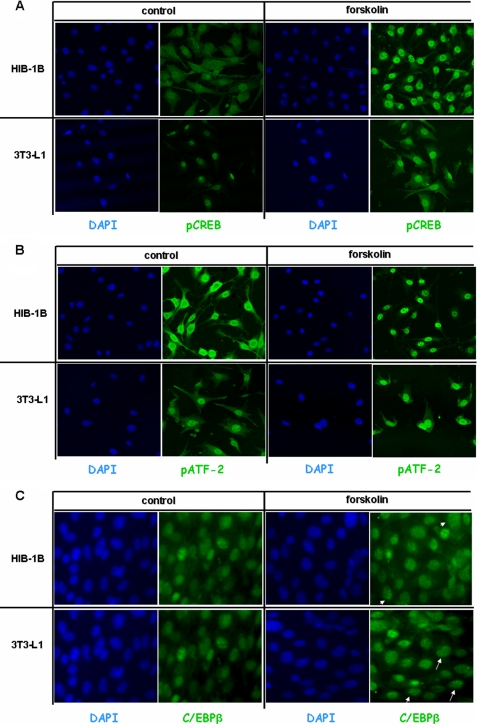
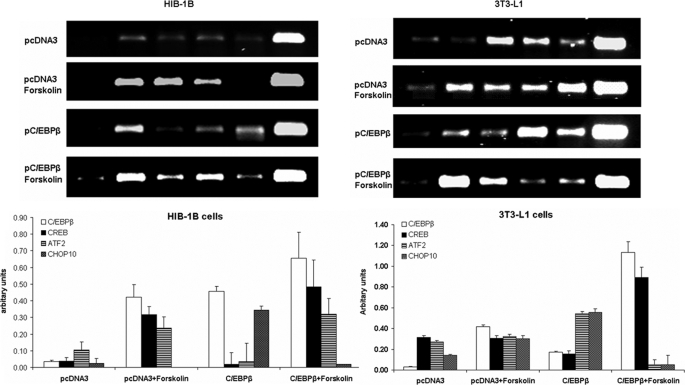
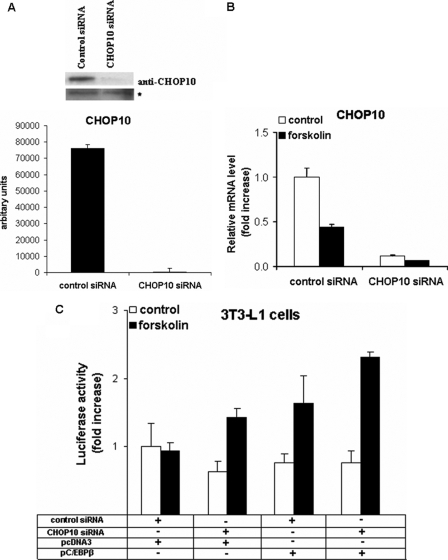
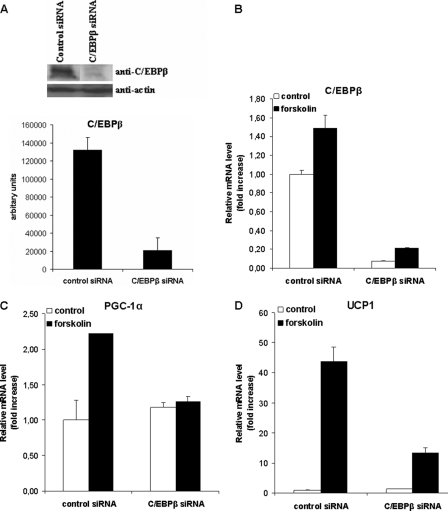
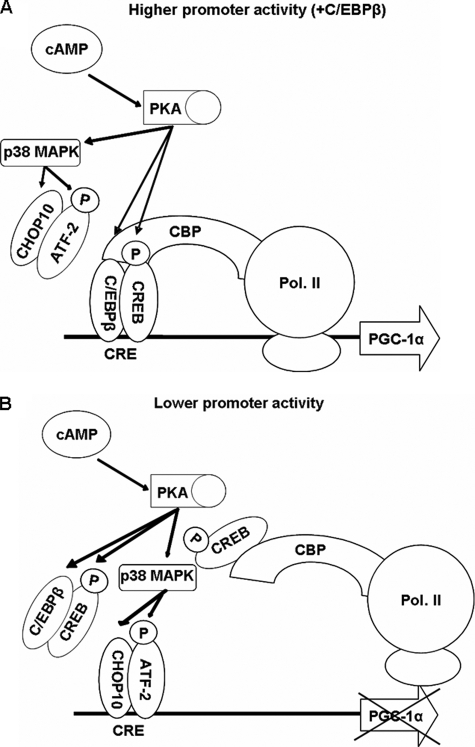
Cold stress in rodents increases the expression of UCP1 and PGC-1alpha in brown and white adipose tissue. We have previously reported that C/EBPbeta specifically binds to the CRE on the proximal Pgc-1alpha promoter and increases forskolin-sensitive Pgc-1alpha and Ucp1 expression in white 3T3-L1 preadipocytes. Here we show that in mice exposed to a cold environment for 24 h, Pgc-1alpha, Ucp1, and C/ebpbeta but not C/ebpalpha or C/ebpdelta expression were increased in BAT. Conversely, expression of the C/EBP dominant negative Chop10 was increased in WAT but not BAT during cold exposure. Reacclimatization of cold-exposed mice to a warm environment for 24 h completely reversed these changes in gene expression. In HIB-1B, brown preadipocytes, forskolin increased expression of Pgc-1alpha, Ucp1, and C/ebpbeta early in differentiation and inhibited Chop10 expression. Employing chromatin immunoprecipitation, we demonstrate that C/EBPbeta, CREB, ATF-2, and CHOP10 are bound to the Pgc-1alpha proximal CRE, but CHOP10 does not bind in HIB-1B cell lysates. Forskolin stimulation and C/EBPbeta overexpression in 3T3-L1 cells increased C/EBPbeta and CREB but displaced ATF-2 and CHOP10 binding to the Pgc-1alpha proximal CRE. Overexpression of ATF-2 and CHOP10 in 3T3-L1 cells decreased Pgc-1alpha transcription. Knockdown of Chop10 in 3T3-L1 cells using siRNA increased Pgc-1alpha transcription, whereas siRNA against C/ebpbeta in HIB-1B cells decreased Pgc-1alpha and Ucp1 expression. We conclude that the increased cAMP stimulation of Pgc-1alpha expression is regulated by the combinatorial effect of transcription factors acting at the CRE on the proximal Pgc-1alpha promoter.


Figures

FIGURE 1.
FIGURE 1.
UCP1, PGC-1α, and C/EBPβ but not C/EBPα, C/EBPδ, or CHOP10 expression are induced during cold stress in mice in iBAT but not gonadal WAT. Animals were maintained at 22 ± 2 °C for 72 h (warm), at 22 ± 2 °C for 48 h followed by 8 ± 2 °C for 24 h (cold), and at 22 ± 2 °C for 24 h and then at 8 ± 2 °C for 24 h followed by a return to 22 ± 2 °C for 24 h (re-acclimatized; Re-aclim). Values were analyzed by qRT-PCR and normalized against 18 S rRNA expression. Values are the average of four animals in each group ± S.E.
FIGURE 2.
FIGURE 2.
cAMP activation by forskolin increases UCP1, PGC-1α, C/EBPβ, and C/EBPδ expression, whereas it decreases CHOP10 expression throughout differentiation. C/EBPα becomes forskolin-inducible only 96 h after inducing differentiation. Cells were treated with forskolin (10 μm) or DMSO for 3 h prior to RNA extraction. Gene expression levels were analyzed by qRT-PCR and normalized against 18 S rRNA expression. Error bars, S.E. of triplicate observations of one of three independent experiments.
FIGURE 3.
FIGURE 3.
CHOP10 is present in confluent 3T3-L1 but not HIB-1B preadipocytes, and overexpression of CHOP10 down-regulates the stimulatory effect of overexpression of C/EBPβ on PGC-1α transcriptional activation. A, Western blotting showing overexpression of CHOP10 (30 kDa) in confluent HIB-1B and 3T3-L1 cells. *, nonspecific binding that serves as a loading control. B, Pgc-1α promoter activity in HIB-1B and 3T3-L1 cells co-transfected with 264PGC1α-pGL3 and an empty control vector pcDNA3 or expression plasmids for C/EBPβ, CHOP10, or a mutant CHOP10, as indicated, and at confluence were treated with forskolin (10 μm) or DMSO for 12 h. C, Pgc-1α reporter activity in HIB-1B and 3T3-L1 cells co-transfected with 264PGC1α-pGL3, pcDNA3, pC/EBPβ, and increasing amounts of pCHOP10, as indicated; at confluence, they were treated with forskolin (10 μm) or DMSO. Error bars, S.E. of triplicate observations of one of three independent experiments.
FIGURE 4.
FIGURE 4.
Cell levels of CREB are higher in confluent 3T3-L1 compared with HIB-1B cells and ATF-2 overexpression decreases the capacity of C/EBPβ and CREB to transactivate the PGC-1α promoter in both 3T3-L1 and HIB-1B cells. A, Western blotting showing overexpression of CREB (43 kDa) and ATF-2 (80 kDa). *, nonspecific binding (loading control). B, PGC-1α promoter activity in HIB-1B and 3T3-L1 cells transiently co-transfected with 264PGC1α-pGL3 and an empty control vector pcDNA3 or expression plasmids for C/EBPβ, CREB, and ATF-2 or combinations, as indicated; at confluence, they were treated with forskolin (10 μm) or DMSO for 12 h. C, Pgc-1α reporter activity in HIB-1B and 3T3-L1 cells co-transfected with 264PGC1α-pGL3, pcDNA3, pC/EBPβ, and increasing amounts of pATF-2 after a 12-h treatment with forskolin (10 μm) or DMSO. Error bars, S.E. of triplicate observations of one of three independent experiments.
FIGURE 5.
FIGURE 5.
Overexpression of LIP down-regulates the stimulatory effect of overexpression of C/EBPβ on PGC-1α transcriptional activation. Pgc-1α promoter activity in HIB-1B and 3T3-L1 cells co-transfected with 264PGC1α-pGL3, pcDNA3, pC/EBPβ, and increasing amounts of pLIP. At confluence, cells were treated with forskolin (10 μm) or DMSO for 12 h. Error bars, S.E. of triplicate observations of one of three independent experiments.
FIGURE 6.
FIGURE 6.
C/EBPβ, CREB, and ATF-2 do not alter the transcription of a control CRE vector in response to cAMP. HIB-1B or 3T3-L1 cells were transiently co-transfected with 4CRE-pGL3 luciferase constructs and expression plasmids for the control pcDNA3, pC/EBPβ, pCREB, pATF-2, or combinations, as indicated, and at confluence, they were treated with forskolin (10 μm) or DMSO for 12 h. Error bars, S.E. of triplicate observations of one of three independent experiments.
FIGURE 7.
FIGURE 7.
Forskolin increases nuclear phospho-CREB but not phospho-ATF-2 in HIB-1B and 3T3-L1 cells. C/EBPβ acquires a punctate fluorescent pattern in the presence of forskolin. HIB-1B and 3T3-L1 preadipocytes were treated with forskolin (10 μm) or DMSO for 30 min, fixed, and treated with antibodies against C/EBPβ, pCREB, and pATF-2, followed by fluorescein isothiocyanate-labeled anti-rabbit IgG, and counterstained by 4′,6-diamidino-2-phenylindole (DAPI). This experiment is representative of similar experiments performed on at least two separate occasions.
FIGURE 8.
FIGURE 8.
Stimulation with forskolin increases C/EBPβ, CREB, and ATF-2 binding to PGC-1α promoter chromatin in HIB-1B cells, independent of the presence of C/EBPβ overexpression. In 3T3-L1 cells, C/EBPβ overexpression and forskolin stimulation result in strong C/EBPβ and CREB binding while diminishing ATF-2 and CHOP10 binding to the PGC-1α-CRE. Shown is a ChIP analysis of bZIP proteins binding to the proximal PGC-1α promoter in confluent HIB-1B or 3T3-L1 cells transfected with control pcDNA3 or pC/EBPβ expression plasmids and treated with forskolin (10 μm) or DMSO for 1 h. The chromatin-associated DNA was incubated with rabbit preimmune serum (PI) or with antibodies against C/EBPβ, CREB, ATF-2, and CHOP10. An aliquot (0.5%) of the total chromatin DNA was used for input. The immunoblots were quantified by densitometric scanning of the films. Levels are presented as enrichment relative to input, corrected for preimmune serum control levels. The results are averages of at least three independent experiments with error bars indicating S.E. values.
FIGURE 9.
FIGURE 9.
CHOP10 siRNA in 3T3-L1 cells induces PGC-1α transcription in response to forskolin and C/EBPβ overexpression. A, Western blot analysis showing knockdown of CHOP10 in 3T3-L1 cells. CHOP10 amounts were quantified by densitometric scanning of the films. *, nonspecific binding (loading control). B, 3T3-L1 cells were transfected with control (non-targeting) siRNA and siRNA targeting Chop10, and 48 h later (at confluence), cells were treated with forskolin (10 μm), where indicated, for 3 h in serum-free conditions. Values were analyzed by qRT-PCR and normalized against 18 S rRNA expression. Error bars, S.E. of triplicate observations of one of three experiments. C, 3T3-L1 cells were transfected with control and CHOP10 siRNA and 12 h later were co-transfected with a reporter plasmid containing 264 bp of the proximal Pgc-1α promoter along with pcDNA3 or C/EBPβ expression plasmids. Thirty-six hours later, cells were incubated with forskolin (10 μm) for 12 h prior to harvesting. Error bar, S.E. of triplicate observations of one of two independent experiments.
FIGURE 10.
FIGURE 10.
C/EBPβ siRNA in HIB-1B cells decreases PGC-1α and UCP1 expression in response to forskolin stimulation. HIB-1B cells were transfected with control (non-targeting) siRNA and siRNA targeting C/ebpβ, and 48 h later, confluent cells were treated with forskolin (10 μm), where indicated, for 3 h in serum-free conditions. Values were analyzed by Western blot analysis (A) with specific antibodies against C/EBPβ and actin and quantified by densitometric scanning of the films. B–D, quantitative RT-PCR values of C/ebpβ, Pgc-1α, and Ucp1 normalized against 18 S rRNA expression. Error bars, S.E. of triplicate observations of one of three experiments.
FIGURE 11.
FIGURE 11.
Model for cAMP stimulation of the proximal PGC-1α promoter in 3T3-L1 cells. A hypothetical model for higher (A) and lower (B) Pgc-1α promoter activity through which the cAMP stimulation of the protein kinase A pathway can give different levels of promoter activity, depending on C/EBPβ cellular concentrations.

Similar articles

Cited by

References

    1. Cinti S. (2006) Nutr. Metab. Cardiovasc Dis. 16, 569–574 - PubMed
    1. Loncar D. (1991) Cell Tissue Res. 266, 149–161 - PubMed
    1. Ashwell M., Stirling D., Freeman S., Holloway B. R. (1987) Int. J. Obes. 11, 357–365 - PubMed
    1. Casteilla L., Champigny O., Bouillaud F., Robelin J., Ricquier D. (1989) Biochem. J. 257, 665–671 - PMC - PubMed
    1. Champigny O., Ricquier D., Blondel O., Mayers R. M., Briscoe M. G., Holloway B. R. (1991) Proc. Natl. Acad. Sci. U.S.A. 88, 10774–10777 - PMC - PubMed

Publication types

MeSH terms

Substances