. 2009 May 18;4(5):e5587.
doi: 10.1371/journal.pone.0005587.

Effect of Ca(v)beta subunits on structural organization of Ca(v)1.2 calcium channels

Affiliations

Effect of Ca(v)beta subunits on structural organization of Ca(v)1.2 calcium channels

Evgeny Kobrinsky et al. PLoS One. .

Abstract

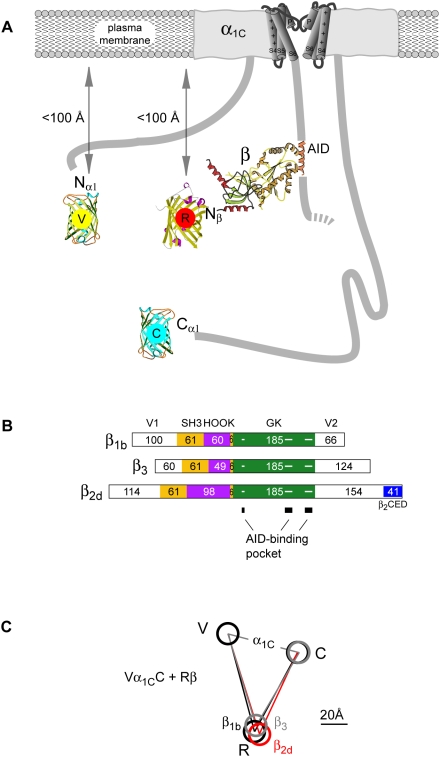
Background: Voltage-gated Ca(v)1.2 calcium channels play a crucial role in Ca(2+) signaling. The pore-forming alpha(1C) subunit is regulated by accessory Ca(v)beta subunits, cytoplasmic proteins of various size encoded by four different genes (Ca(v)beta(1)-beta(4)) and expressed in a tissue-specific manner.

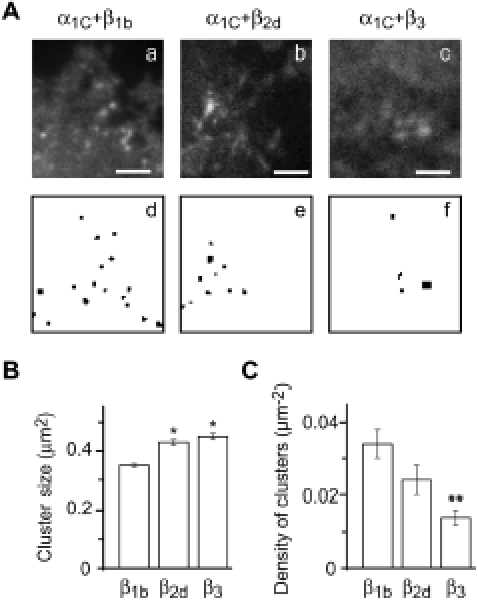
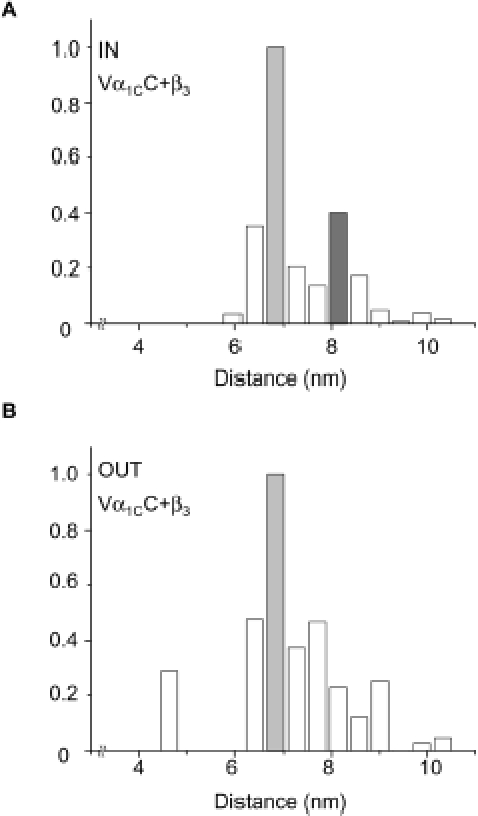
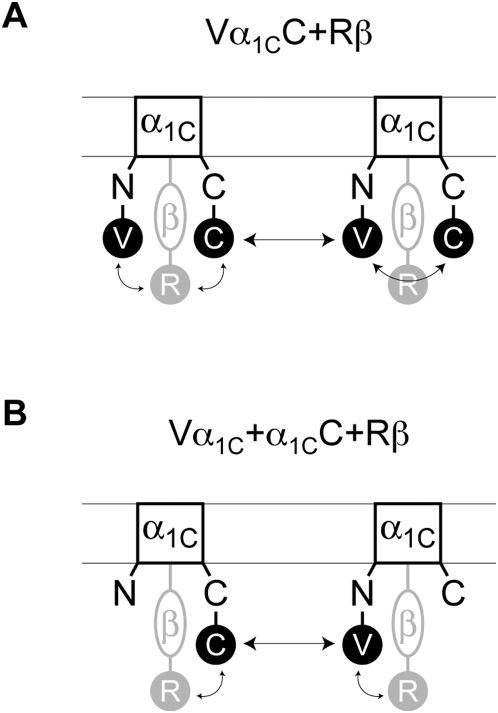
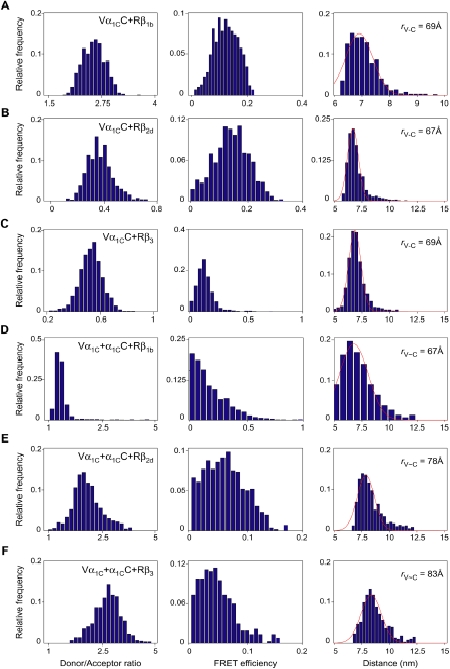
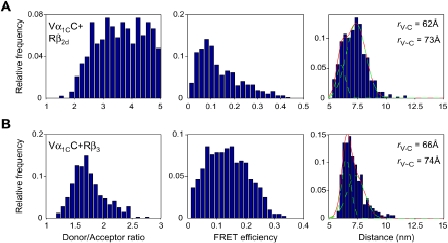
Methods and results: Here we investigated the effect of three major Ca(v)beta types, beta(1b), beta(2d) and beta(3), on the structure of Ca(v)1.2 in the plasma membrane of live cells. Total internal reflection fluorescence microscopy showed that the tendency of Ca(v)1.2 to form clusters depends on the type of the Ca(v)beta subunit present. The highest density of Ca(v)1.2 clusters in the plasma membrane and the smallest cluster size were observed with neuronal/cardiac beta(1b) present. Ca(v)1.2 channels containing beta(3), the predominant Ca(v)beta subunit of vascular smooth muscle cells, were organized in a significantly smaller number of larger clusters. The inter- and intramolecular distances between alpha(1C) and Ca(v)beta in the plasma membrane of live cells were measured by three-color FRET microscopy. The results confirm that the proximity of Ca(v)1.2 channels in the plasma membrane depends on the Ca(v)beta type. The presence of different Ca(v)beta subunits does not result in significant differences in the intramolecular distance between the termini of alpha(1C), but significantly affects the distance between the termini of neighbor alpha(1C) subunits, which varies from 67 A with beta(1b) to 79 A with beta(3).

Conclusions: Thus, our results show that the structural organization of Ca(v)1.2 channels in the plasma membrane depends on the type of Ca(v)beta subunits present.


Conflict of interest statement

Competing Interests: The authors have declared that no competing interests exist.

Figures

Figure 1
Figure 1. Effect of Cavβ subunits on cluster organization of Cav1.2 channels.
(A) TIRF images (a–c) and wavelet-derived clusters (d–f) of Cav1.2 channels containing β1b (a,d), β2d (b,e) or β3 (c,f). Scale, 4.5 µm. (B) Dependence of the average size of Cav1.2 clusters on the type of Cavβ present. β1b, mean size±SEM, 0.360±0.005 µm2 (number of clusters analyzed m = 1253); β2d, 0.430±0.013 mm2 (m = 270); β3, 0.450±0.017 µm2 (m = 205). *, P<0.001 relative to β1b. (C) Dependence of the number of Cav1.2 clusters (normalized to the area measured and defined as density) on the type of Cavβ present. β1b, mean number±SEM, 0.034±0.004 mm−2 (number of cells n = 27); β2d, 0.024±0.04 µm−2 (n = 30); β3, 0.014±0.02 µm−2 (n = 22). **, P<0.01 relative to β1b. Vα1C was co-expressed with α2δ and indicated Cavβ in COS1 cells.
Figure 2
Figure 2. Intramolecular vs. intermolecular FRET in Vα1CC revealed in TIRF images.
1CC, α2δ and β3 were co-expressed in COS1 cells. Two-color FRET was measured in TIRF images and converted into distances r between V and C as described in Methods. Shown are normalized cumulative histograms (n = 11) for r calculated for ROI inside clusters (A, total number of pixels m = 231) and outside clusters (B, m = 3908) identified by wavelet transform. The same intramolecular (r V-C) distance ≈6.8 nm (light gray bars) was observed both inside and outside clusters, while intermolecular (r V∼C) distance ≈8.1 nm was observed only in clusters (dark gray).
Figure 3
Figure 3. Investigated combinations of the labeled α1C and β subunits for three color FRET measurements.
1CC and Rβ (A) and Vα1C, α1CC and Rβ (B) were co-expressed with α2δ (not shown). Arrows indicate revealed intramolecular and intermolecular distances.
Figure 4
Figure 4. Estimation of distance r between fluorophores fused to the N- and/or C-termini of the α1C subunit.
(A–C) Intramolecular FRET recorded with Vα1CC. (D–F) Intermolecular FRET recorded with Vα1C1CC. Channels were co-expressed in COS1 cells with α2δ and Rβ1b (A and D), Rβ2d (B and E) or Rβ3 (C and F). Shown are representative of histograms calculated from single exemplary cells for donor/acceptor ratio (left column), FRET efficiency (middle column) and distance (right column). Relative frequency was calculated for total number of pixels in ROI as described in Methods. The red solid line is the best fit to a Gaussian distribution with indicated means for r V-C and r V∼C.
Figure 5
Figure 5. Intramolecular vs. intermolecular FRET in Vα1CC.
The Vα1CC subunit was co-expressed in COS1 cells with α2δ and Rβ2d (A) or Rβ3 (B). Shown are histograms of donor/acceptor ratio (left column), FRET efficiency (middle column) and distance (right column) determined in the plasma membrane region of two representative COS1 cells. The red solid line is the best fit to a sum of two Gaussian distributions with indicated means (green dotted lines) for intramolecular (r C-V) and intermolecular FRET (r C∼V).
Figure 6
Figure 6. Molecular distances between the N- and C-termini of α1C and the Cavβ-subunit N-tail of β1b, β2d and β3.
(A) Schematic representation of Vα1CC with Rβ arranged under a vertically sliced α1C. The structures of TagRFP and Cavβ core MAGUK region were drawn based on PDB codes 1uisA and 1t0j , respectively. FRET measurements with ECFP-labeled plekstrin homology domain in the inner leaflet of the plasma membrane , showed that the N terminal tags of both the α1C and Cavβ subunits are located within the 2× Förster distance (<100 Å for ECFP/EYFP) from the plasma membrane. (B) Schematic representation of the domain organization of β1b, β2d and β3 aligned in regard to AID-binding guanylate kinase (GK) domain (green). Yellow box indicates the Src homology 3 (SH3) domain, purple the variable HOOK region, and blue the β2CED . Number of amino acids is shown inside boxes. Amino acids involved in AID-binding pocket are marked in GK by three horizontal lines (for details see [62], [64], [65]). (C) Schematic representation of the results of simultaneous measurements of the molecular distances between three fluorophores shown in panel (A) in Vα1CC/α2δ/Rβ in the presence of Rβ1b (black lines), Rβ3 (gray lines) and Rβ2d (red lines).

Similar articles

Cited by

References

    1. Clapham DE. Calcium signaling. Cell. 1995;80:259–268. - PubMed
    1. Lipscombe D, Madison DV, Poenie M, Reuter H, Tsien RY, et al. Spatial distribution of calcium channels and cytosolic calcium transients in growth cones and cell bodies of sympathetic neurons. Proc Natl Acad Sci USA. 1988;85:2398–2402. - PMC - PubMed
    1. Silver RA, Lamb AG, Bolsover SR. Calcium hotspots caused by L-channel clustering promote morphological changes in neuronal growth cones. Nature. 1990;343:751–754. - PubMed
    1. Westenbroek RE, Ahlijanian MK, Catterall WA. Clustering of L-type Ca2+ channels at the base of major dendrites in hippocampal pyramidal neurons. Nature. 1990;347:281–284. - PubMed
    1. Franzini-Armstrong C, Protasi F, Ramesh V. Comparative ultrastructure of Ca2+ release units in skeletal and cardiac muscle. Ann NY Acad Sci. 1998;853:20–30. - PubMed

Publication types

MeSH terms