. 2009 Jun 3;4(6):e5780.
doi: 10.1371/journal.pone.0005780.

Surface-associated plasminogen binding of Cryptococcus neoformans promotes extracellular matrix invasion

Affiliations

Surface-associated plasminogen binding of Cryptococcus neoformans promotes extracellular matrix invasion

Jamal Stie et al. PLoS One. .

Abstract

Background: The fungal pathogen Cryptococcus neoformans is a leading cause of illness and death in persons with predisposing factors, including: malignancies, solid organ transplants, and corticosteroid use. C. neoformans is ubiquitous in the environment and enters into the lungs via inhalation, where it can disseminate through the bloodstream and penetrate the central nervous system (CNS), resulting in a difficult to treat and often-fatal infection of the brain, called meningoencephalitis. Plasminogen is a highly abundant protein found in the plasma component of blood and is necessary for the degradation of fibrin, collagen, and other structural components of tissues. This fibrinolytic system is utilized by cancer cells during metastasis and several pathogenic species of bacteria have been found to manipulate the host plasminogen system to facilitate invasion of tissues during infection by modifying the activation of this process through the binding of plasminogen at their surface.

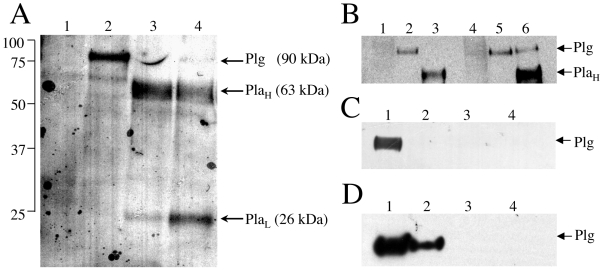
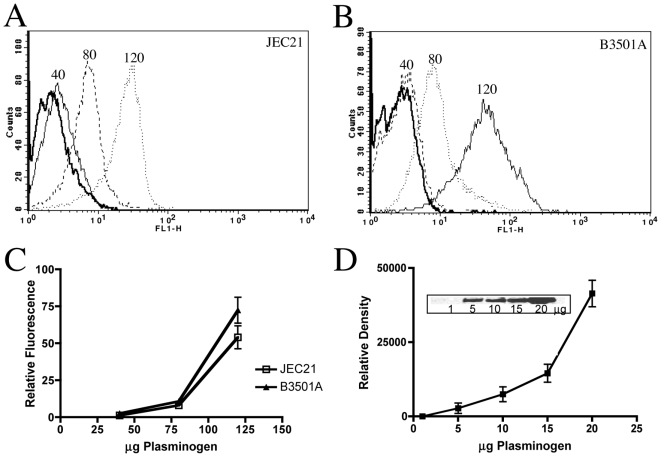
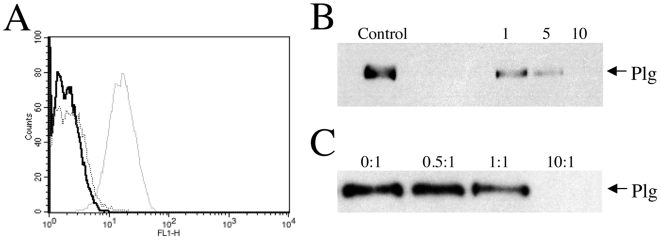
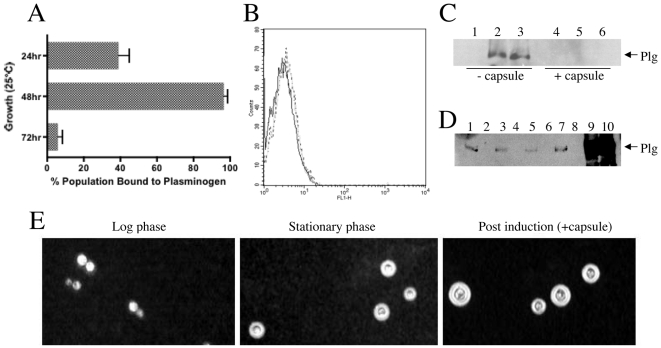
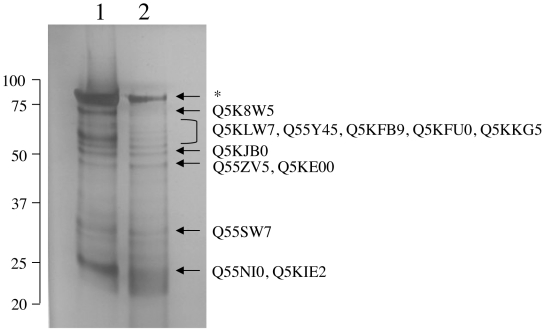
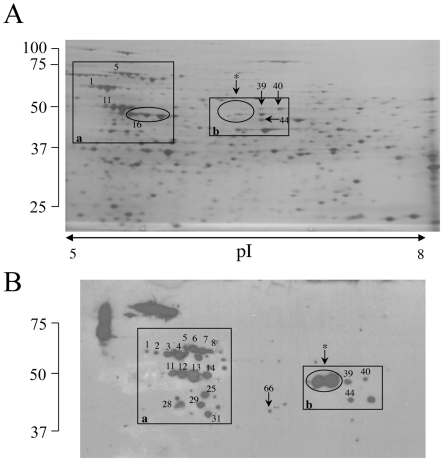
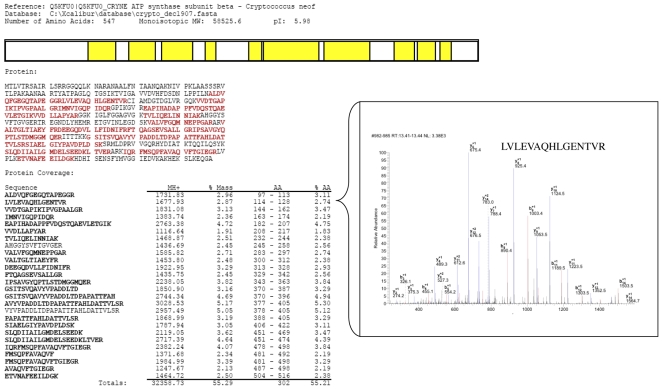
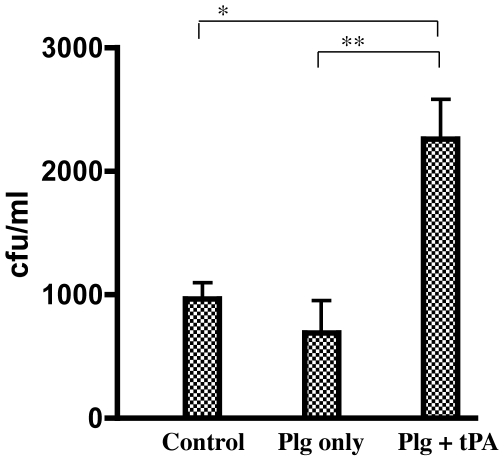
Methodology: The invasion of the brain and the central nervous system by penetration of the protective blood-brain barrier is a prerequisite to the establishment of meningoencephalitis by the opportunistic fungal pathogen C. neoformans. In this study, we examined the ability of C. neoformans to subvert the host plasminogen system to facilitate tissue barrier invasion. Through a combination of biochemical, cell biology, and proteomic approaches, we have shown that C. neoformans utilizes the host plasminogen system to cross tissue barriers, providing support for the hypothesis that plasminogen-binding may contribute to the invasion of the blood-brain barrier by penetration of the brain endothelial cells and underlying matrix. In addition, we have identified the cell wall-associated proteins that serve as plasminogen receptors and characterized both the plasminogen-binding and plasmin-activation potential for this significant human pathogen.

Conclusions: The results of this study provide evidence for the cooperative role of multiple virulence determinants in C. neoformans pathogenesis and suggest new avenues for the development of anti-infective agents in the prevention of fungal tissue invasion.


Conflict of interest statement

Competing Interests: The authors have declared that no competing interests exist.

Figures

Figure 1
Figure 1. Plasminogen binds selectively and specifically to the cell-surface of intact C. neoformans strains.
(A–B) Conversion of plasminogen (Plg) into plasmin heavy chain (PlaH) and light chain (PlaL) on the surface of intact C. neoformans serotype D and A strains. (A) Serotype D strain JEC21 was incubated in the presence or absence of plasminogen, tissue plasminogen activator (tPA), and/or the plasmin inhibitor aprotinin in phosphate-buffered saline with BSA. Cell wall proteins were released by boiling labeled cells in SDS-extraction buffer and fractionated by SDS-PAGE, transferred to PVDF, and Western blotted with polyclonal anti-plasminogen antibody. Lane descriptions as follow: cells (JEC21) only (1), 100 µg plasminogen (2), plasminogen and 100 ng tPA (3), plasminogen, tPA, and 1 unit aprotinin (4). (B) Serotype A strains C23 and A1 38-2 were incubated in the presence or absence of plasminogen and/or tPA for 4 hrs at 37°C prior to Western blot analysis as described above. Lanes: cells (C23) only (1), C23 with 15 µg plasminogen (2), C23 with plasminogen and 100 ng tPA (3), cells (A1 38-2) only (4), A1 38-2 with 15 µg plasminogen (5), and A1 38-2 with plasminogen and tPA (6). (C) Plasminogen associates with the cell wall of intact cells. Cells (1×10¹⁰) from log phase cultures (JEC21) were incubated 4 hr at 37°C in the presence (lane 1) or absence (lane 3) of 50 µg plasminogen and separated into cell wall and cytosol components, as described in Methods. Membranes (lane 2, 4) from cell walls were extracted and each fraction examined for the presence of plasminogen by Western blot analysis. Sample loading was uniform at 5 µg per well. (D) Sulfo-NHS-biotin and plasminogen compete for cell-surface binding sites. Log phase cells (JEC21) were initially labeled with sulfo-NHS-biotin in 0-, 1-, 10-, 100-fold molar equivalents of plasminogen then labeled 1 hr at 37°C with 50 µg plasminogen (lanes 1–4, respectively).
Figure 2
Figure 2. Plasminogen binding capacity of C. neoformans surface receptors.
(A–B) Representative histograms for JEC21 (A) and B3501A (B) cultured at 25°C for 48 hr in 50 ml YPD. Cells were suspended at 107/ml and labeled for 1 hr at 37°C with 40 µg (solid line), 80 µg (dashed line), or 120 µg (dotted line) plasminogen, followed by exposure to rabbit anti-human plasminogen antiserum and FITC-conjugated secondary antibody. The numbers located above each curve in the histograms indicate plasminogen-labeling concentration (µg) for corresponding populations. Each histogram shows cell number as a function of relative fluorescence obtained for a total of 10,000 events per population. The control population (bold solid line) was treated with primary and secondary antibody in the absence of plasminogen labeling. Greater than 90% of the cells examined stained positive for plasminogen under the growth conditions applied, so gating was not necessary. Each data set is representative of three independent experiments. (C) Plasminogen binding curves for JEC21 (squares) and B3501A (closed triangles) cultured and plasminogen-labeled as in (A–B), averaged from six independent experiments. Data were adjusted for nonspecific binding, which is represented by the baseline. (Kd JEC21 = 900 nM, Kd B3501A = 750 nM). (D) Plasminogen binding curve of JEC21 as detected by Western blot analysis from three independent experiments. Cells were incubated with the indicated concentrations of plasminogen for 1 hr 37°C then examined for surface-bound plasminogen by Western blot analysis. The graph shows the relative signal density detected for the plasminogen concentrations indicated on the abscissa. A representative blot is shown with plasminogen concentrations (µg) concentrations indicated below each band.
Figure 3
Figure 3. Surface-exposed lysines are required for plasminogen binding.
(A–B) Influence of carboxypeptidase B pretreatment on plasminogen binding. Cells were grown to log phase at 25°C and incubated 30 min at 37°C in the presence of carboxypeptidase B prior to a subsequent incubation with 50 µg plasminogen for 1 hr at 37°C and examination by either: flow cytometry (A), or Western blot analysis (B). In (A), the control population, indicated by a solid black line, was treated with primary and secondary antibody in the absence of plasminogen labeling. The dashed line represents cells incubated in the absence of carboxypeptidase (0 units) prior to plasminogen labeling (50 µg), while the population depicted by the solid gray line was pretreated with 10 units of carboxypeptidase prior to the addition of 50 µg plasminogen. In (B), carboxypeptidase treatments (in units), prior to the addition of plasminogen, are labeled as control (0 U), 1 (1 U), 5 (5 U), and 10 (10 U) above each corresponding sample lane. Plasminogen incubation for 1 hr at 37°C was followed by extensive washing and subsequent Western blot analysis of plasminogen binding. (C) Effects of εACA pretreatment on plasminogen binding. Cells were incubated for 30 min at 37°C with εACA at 0, 0.5, 1, or 10 molar equivalents in excess of the concentration of plasminogen used (20 µg, ∼400 nM). Plasminogen was added after the initial εACA incubation, followed by an additional incubation for 1 hr at 37°C and subsequent Western blot analysis of plasminogen binding. The molar ratios of εACA∶plasminogen are noted above the lanes for each corresponding sample. The data shown are representative of three independent experiments.
Figure 4
Figure 4. Effects of growth phase and capsule development on plasminogen binding activity of C. neoformans.
(A) Plasminogen binding capacity at distinct stages of cell growth in YPD culture media. Serotype D strain JEC21 was incubated for the times indicated in 50 ml YPD and measured by flow cytometry for the ability to bind plasminogen. The data shown were quantified from flow cytometry histograms as the percent plasminogen binding over control (abscissa) for each time point described (ordinate) and are representative three independent experiments. The 24, 48 and 72 hr time-points indicated correspond to lag, log and stationary growth phases, respectively. (B–D) Plasminogen binding activity of encapsulated cells. Flow cytometry histogram (B) and PAGE/Western blot (C) showing little or no plasminogen binding activity for encapsulated JEC21 cells compared to reduced capsule (uninduced and DMSO-treated) controls. Strain JEC21 was grown in either YPD (C; lanes 1–3) or capsule induction (C; lanes 4–6) medium prior to labeling for: 1 hr (B) or 4 hr (C) at 37°C with 120 µg (B, broken line) or 100 µg (C; lanes 2–3, 5–6) plasminogen. Lanes 3 and 5 of (C) were treated 1 hr with DMSO prior to receiving 100 µg plasminogen. Control cells (B, bold line; C, lanes 1 and 4) received primary and secondary antibody in the absence of plasminogen labeling. (D) Western blot analysis of plasminogen binding activity for serotype D strains JEC21, FCH79 (CAP59 cap59::nat), FCH78 (cap59::nat), and the serotype A strains C23 and A1 38-2. Cells were grown in YPD (−cap) or capsule induction (+cap) medium, labeled with plasminogen, and subjected to Western blot analysis, as described above, Lanes: JEC21 −cap (1), JEC21 +cap (2), FCH79 −cap (3), FCH79 +cap (4), C23 −cap (5), C23 +cap (6), A1 38-2 −cap (7), A1 38-2 +cap (8), FCH78 −cap (9), and FCH78 +cap (10). (E) Examination of capsule formation. Aliquots of strain JEC21 were examined at log or stationary growth phases, or after incubation in capsule induction medium, and examined for capsule by India ink staining at 40× magnification. Results are averaged (A) from three independent experiments or representative of either two (D) or three experiments (B–C).
Figure 5
Figure 5. Identification of plasminogen-binding cell wall proteins by 1D-PAGE and LC-MS/MS.
Precipitation of purified cell wall protein preparations made from strain B3501A with plasminogen-conjugated CNBr-sepharose beads. Protein profiles obtained from bead eluate fractions (lane 1 = fraction 1, lane 2 = fraction 2) are compared after silver staining of 10% SDS-PAGE gels. Molecular weights are indicated on the left. The data shown is representative of three experiments. Indicated are the positions of identified plasminogen-binding proteins. Identified proteins are listed in Table S1.
Figure 6
Figure 6. Identification of plasminogen-binding cell wall proteins of C. neoformans by 2D-PAGE and LC-MS/MS.
Two-dimensional gel electrophoretic characterization of the cell wall proteome from a silver-stained gel (A), and the corresponding plasminogen-binding proteins (B) by ligand (plasminogen) overlay and western blot analysis with anti-plasminogen antibody. Indicated are the positions of identified plasminogen-binding proteins. Identified proteins shown in (B) are listed in Table S2. (* indicates spots sequenced following excision from the PVDF membrane due to lack of detection by silver-staining).
Figure 7
Figure 7. Identification of spot 12 as Q5KFU0, an ATP synthase beta subunit.
Overview of identification is shown. Shaded areas (yellow in graphical display and red for protein sequence) indicate peptide coverage. Shown as an inset is a representative MS/MS spectra for peptide [LVLEVAQHLGENTVR] from Q5KFU0.
Figure 8
Figure 8. Penetration of C. neoformans through reconstituted ECM.
The ECM invasion chambers are composed of matrigel (basement membrane) layered on membranes with 8 µm pores. Strain JEC21 was incubated with plasminogen in phosphate-buffered saline with BSA in the presence or absence of tissue-derived plasminogen activator (tPA), incubated in the upper chamber of the transwell for 24 hours at 37°C prior to analysis of colony counts from the lower well (* (p = 0.0093); ** (p = 0.0084)).

Similar articles

Cited by

References

    1. Chang YC, Stins MF, McCaffery MJ, Miller GF, Pare DR, et al. Cryptococcal yeast cells invade the central nervous system via transcellular penetration of the blood-brain barrier. Infect Immun. 2004;72(9):4985–4995. - PMC - PubMed
    1. Charlier C, Chretien F, Baudrimont M, Mordelet E, Lortholary O, et al. Capsule structure changes associated with Cryptococcus neoformans crossing of the blood-brain barrier. Am J Pathol. 2005;166(2):421–432. - PMC - PubMed
    1. Chen SH, Stins MF, Huang SH, Chen YH, Kwon-Chung KJ, et al. Cryptococcus neoformans induces alterations in the cytoskeleton of human brain microvascular endothelial cells. J Med Microbiol. 2003;52(Pt 11):961–970. - PubMed
    1. Chretien F, Lortholary O, Kansau I, Neuville S, Gray F, et al. Pathogenesis of cerebral Cryptococcus neoformans infection after fungemia. J Infect Dis. 2002;186(4):522–530. - PubMed
    1. Huang SH, Jong AY. Cellular mechanisms of microbial proteins contributing to invasion of the blood-brain barrier. Cell Microbiol. 2001;3(5):277–287. - PubMed

Publication types