. 2009 May 25;4(5):e5684.
doi: 10.1371/journal.pone.0005684.

SLC30A3 responds to glucose- and zinc variations in beta-cells and is critical for insulin production and in vivo glucose-metabolism during beta-cell stress

Affiliations

SLC30A3 responds to glucose- and zinc variations in beta-cells and is critical for insulin production and in vivo glucose-metabolism during beta-cell stress

Kamille Smidt et al. PLoS One. .

Abstract

Background: Ion transporters of the Slc30A- (ZnT-) family regulate zinc fluxes into sub-cellular compartments. beta-cells depend on zinc for both insulin crystallization and regulation of cell mass.

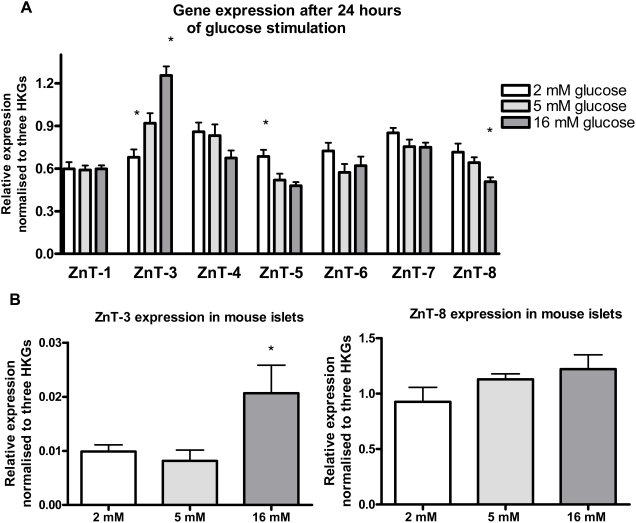
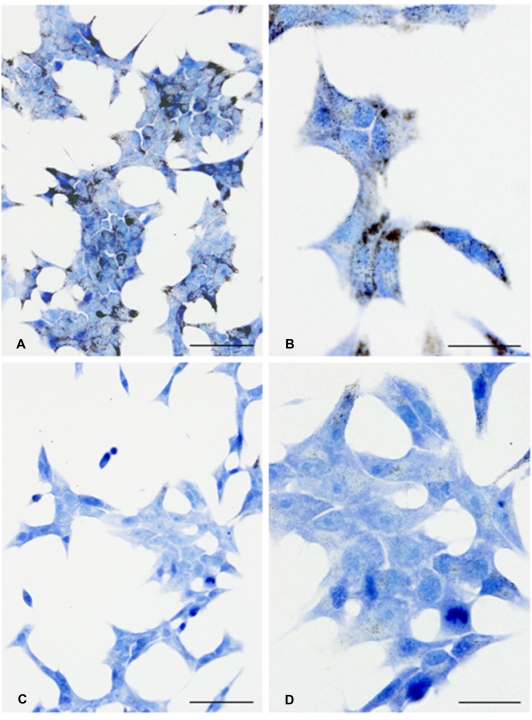
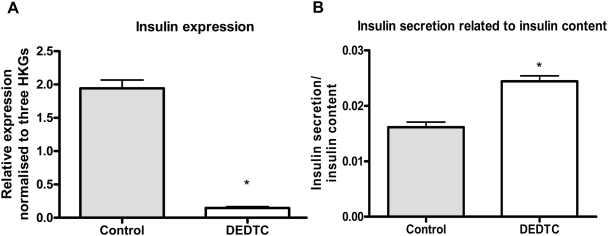
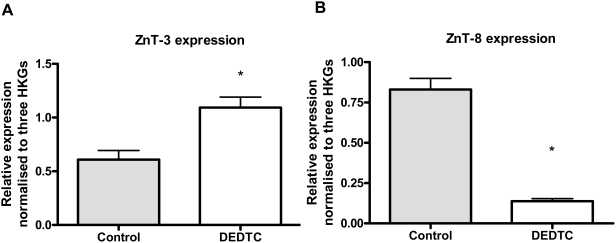
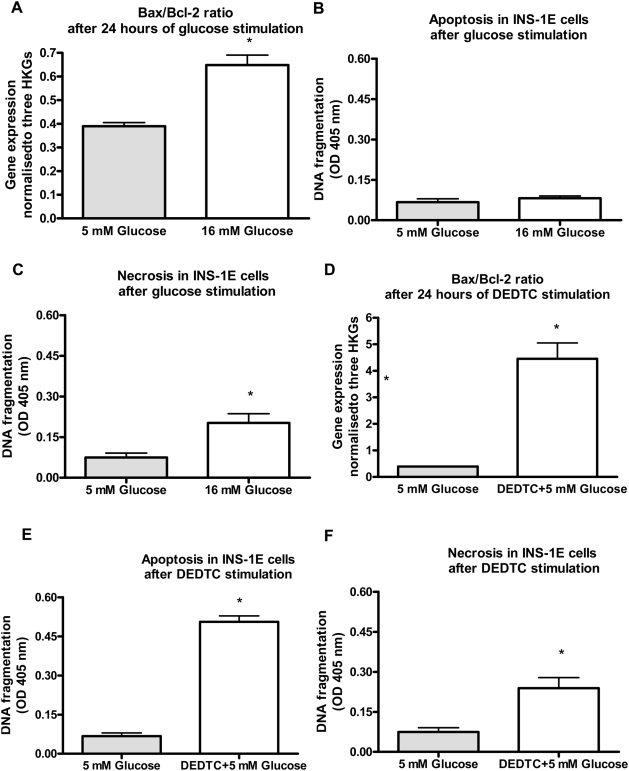
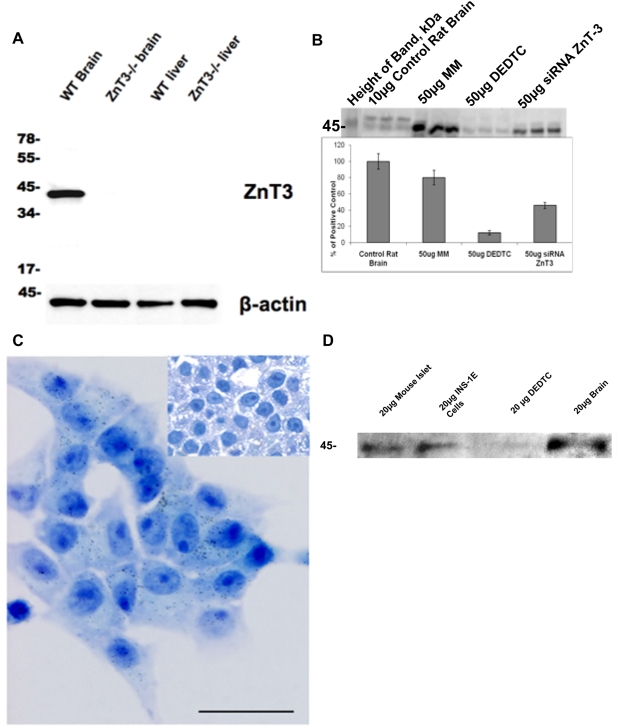
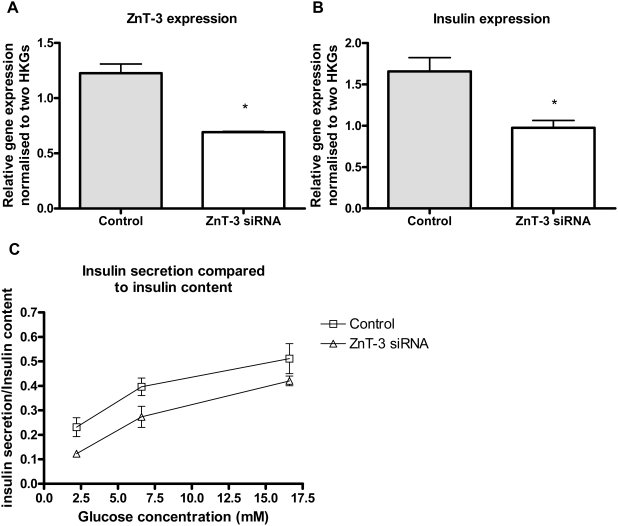
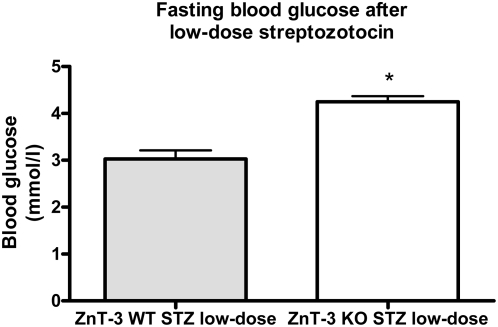
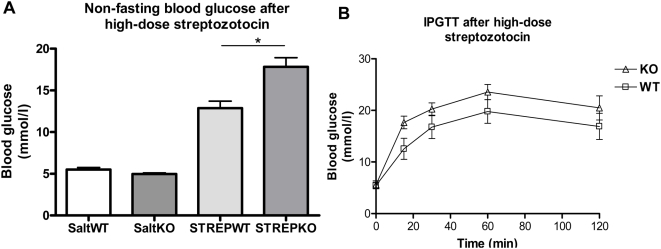
Methodology/principal findings: This study examined: the effect of glucose and zinc chelation on ZnT gene and protein levels and apoptosis in beta-cells and pancreatic islets, the effects of ZnT-3 knock-down on insulin secretion in a beta-cell line and ZnT-3 knock-out on glucose metabolism in mice during streptozotocin-induced beta-cell stress. In INS-1E cells 2 mM glucose down-regulated ZnT-3 and up-regulated ZnT-5 expression relative to 5 mM. 16 mM glucose increased ZnT-3 and decreased ZnT-8 expression. Zinc chelation by DEDTC lowered INS-1E insulin content and insulin expression. Furthermore, zinc depletion increased ZnT-3- and decreased ZnT-8 gene expression whereas the amount of ZnT-3 protein in the cells was decreased. Zinc depletion and high glucose induced apoptosis and necrosis in INS-1E cells. The most responsive zinc transporter, ZnT-3, was investigated further; by immunohistochemistry and western blotting ZnT-3 was demonstrated in INS-1E cells. 44% knock-down of ZnT-3 by siRNA transfection in INS-1E cells decreased insulin expression and secretion. Streptozotocin-treated mice had higher glucose levels after ZnT-3 knock-out, particularly in overt diabetic animals.

Conclusion/significance: Zinc transporting proteins in beta-cells respond to variations in glucose and zinc levels. ZnT-3, which is pivotal in the development of cellular changes as also seen in type 2 diabetes (e.g. amyloidosis in Alzheimer's disease) but not previously described in beta-cells, is present in this cell type, up-regulated by glucose in a concentration dependent manner and up-regulated by zinc depletion which by contrast decreased ZnT-3 protein levels. Knock-down of the ZnT-3 gene lowers insulin secretion in vitro and affects in vivo glucose metabolism after streptozotocin treatment.


Conflict of interest statement

Competing Interests: The authors have declared that no competing interests exist.

Figures

Figure 1
Figure 1. Relative gene expression of ZnTs in INS-1E cells and mouse islets after 24 hours of glucose stimulation.
A) INS-1E cells: Stimulations were performed at 2, 5 or 16 mM glucose. Normalised to UBC-7, CycA and β-actin. Data are mean and SEM (*p<0.05). N = 9. B) Mouse islets: Stimulations were performed at 2, 5 or 16 mM glucose. Normalised to UBC-7, CycA and HPRT. Data are mean and SEM (*p<0.05). N = 6.
Figure 2
Figure 2. Zinc content of INS-1E cells.
(A+B) Zn2+ autometallography of untreated INS-1E cells. (A) 40×. Bar = 50 µm. (B) 100×. Bar = 20 µm. (C+D) DEDTC treatment for 24 hours removed most autometallographically-detectable Zn2+ from the INS-1E cells. (C) 40×. Bar = 50 µm. (D) 100×. Bar = 20 µm.
Figure 3
Figure 3. Insulin expression, content and secretion after 24 hours of 100 µM DEDTC treatment.
INS-1E cells were treated with DEDTC at 5 mM glucose. A) Insulin gene expression normalized to Cltc, HPRT and HSPcb. Data are mean and SEM (*p<0.01). N = 6. B) Insulin secretion related to insulin content in INS-1E cells. Data are mean and SEM (*p<0.01). N = 3.
Figure 4
Figure 4. Relative gene expression of ZnT-3 and ZnT-8 after 24 hours of 100 µM DEDTC treatment.
INS-1E cells were treated with DEDTC at 5 mM glucose. A) ZnT-3 gene expression normalised to Cltc, HPRT and HSPcb. Data are mean and SEM (*p<0.05). N = 6. B) ZnT-8 gene expression normalised to Cltc, HPRT and HSPcb. Data are mean and SEM (*p<0.01). N = 6.
Figure 5
Figure 5. Detection of apoptosis in INS-1E cells after 24 hours of hyperglycamia or zinc depletion.
A–C) Glucose stimulation with 5 mM and 16 mM. A) Bax/Bcl-2 ratio of gene expression. Both genes were normalised to Cltc, HPRT and HSPcb. Data are mean and SEM (*p<0.01). N = 6. B) Detection of intracellular DNA fragments in INS-1E cells (apoptosis) after 16 mM glucose stimulation. Data are mean and SEM. N = 4. C) Detection of DNA fragments in medium from INS-1E cells (necrosis) treated 16 mM glucose. Data are mean and SEM (*p<0.05). N = 4. D–F) Zinc chelation with 100 µM DEDTC. D) Bax/Bcl-2 ratio of gene expression. Both genes were normalised to Cltc, HPRT and HSPcb. Data are mean and SEM (*p<0.01). N = 6. E) Detection of DNA fragments in INS-1E (apoptosis) after 100 µM DEDTC treatment. Data are mean and SEM (*p<0.01) N = 4. F) Detection of DNA fragments in medium from INS-1E cells (necrosis) treated with 100 µM DEDTC. Data are mean and SEM (*p<0.01). N = 4.
Figure 6
Figure 6. ZnT-3 protein in INS-1E cells and mouse islets.
A) Western blot of ZnT-3 knockout tissue, and normal background strain tissue using the anti-ZnT-3 polyclonal antibody (20 µg per lane). B) Western blot with ZnT-3 antibody. Lane one shows the protein marker in kDa. Subsequent lanes: Control rat brain (10 µg protein) (lanes 2–4), mock transfected INS1-E cells (50 µg protein) (lanes 5–7), 100 µM DEDTC-treated INS1-E cells (50 µg protein) (lanes 8–10), ZnT-3 siRNA transfected INS1-E cells (50 µg protein) (lanes 11–13). Insert shows the quantification, brain tissue values are original multiplied by 5. C) Light micrograph of INS-1E cells exposed to ZnT-3 antibody. Silver enhanced colloidal gold (10 nm) particles attached to secondary antibodies against the ZnT-3 primary antibody are seen within the cells. There was no background stain and controls were negative (insert). Bar = 20 µm. D) Demonstration of ZnT3 antibody positivity in intact mouse islets (lane 1), compared with INS-1E cells before (lane 2) and after (lane 3) treatment with 100 µM DEDTC and brain tissue (lane 4). Each upload with 20 µg protein.
Figure 7
Figure 7. Knock-down of ZnT-3 in INS-1E cells.
A) Relative gene expression of ZnT-3 in ZnT-3 knock-downed INS-1E cells compared to mismatch controls. ZnT-3 gene expression normalised to β-actin and HSP. Data are mean and SEM (*p<0.05) N = 3. B) Relative gene expression of insulin in ZnT-3 knock-down INS-1E cells. Insulin gene expression normalised to β-actin and HSP. Data are mean and SEM (*p<0.05). N = 3. C) Glucose stimulated insulin secretion in ZnT-3 knock-down INS-1E cells. Cells were stimulated with either 2, 6.6 or 16.6 mM glucose for 2 hours. Insulin secretion was normalised to insulin content. Data are mean and SEM (p<0.01 for AUC). N = 4.
Figure 8
Figure 8. Fasting glucose levels after low-dose streptozotozin in ZnT-3−/− knock-out mice.
ZnT-3−/− knock-out mice and control mice were treated with 50 mg/kg/day for five days. Data are mean and SEM (*p<0.01). N = 15.
Figure 9
Figure 9. High-dose streptozotocin for three days in ZnT-3−/− knockout mice and control mice.
Following a series of low-dose exposures (see Fig. 8) ZnT-3−/− knock-out mice and control mice were treated with 200 mg/kg/day. A) Non-fasting morning blood glucose levels. Salt indicates sham saline injections. Data are mean and SEM (*p<0.01). B) Intraperitoneal glucose tolerance test in ZnT-3−/− knockout mice and control mice after high-dose streptozotozin. Blood glucose concentrations were measured before and 15, 30, 60 and 120 minutes after the glucose injection. Significantly higher AUC0–120 in knock-out vs WT mice (p<0.01). N = 5 for ZnT-3−/− and n = 4 for wild type.

Similar articles

Cited by

References

    1. Vallee BL, Falchuk KH. The biochemical basis of zinc physiology. Physiol Rev. 1993;73:79–118. - PubMed
    1. Chausmer AB. Zinc, insulin and diabetes. J Am Coll Nutr. 1998;17:109–115. - PubMed
    1. Ishihara H, Maechler P, Gjinovci A, Herrera PL, Wollheim CB. Islet beta-cell secretion determines glucagon release from neighbouring alpha-cells. Nat Cell Biol. 2003;5:330–335. - PubMed
    1. Franklin I, Gromada J, Gjinovci A, Theander S, Wollheim CB. Beta-cell secretory products activate alpha-cell ATP-dependent potassium channels to inhibit glucagon release. Diabetes. 2005;54:1808–1815. - PubMed
    1. Chang I, Cho N, Koh JY, Lee MS. Pyruvate inhibits zinc-mediated pancreatic islet cell death and diabetes. Diabetologia. 2003;46:1220–1227. - PubMed

Publication types

MeSH terms