

Monoclonal antibody interactions with micro- and nanoparticles: adsorption, aggregation, and accelerated stress studies
- PMID: 19492408
- PMCID: PMC2749556
- DOI: 10.1002/jps.21768
Monoclonal antibody interactions with micro- and nanoparticles: adsorption, aggregation, and accelerated stress studies
Abstract
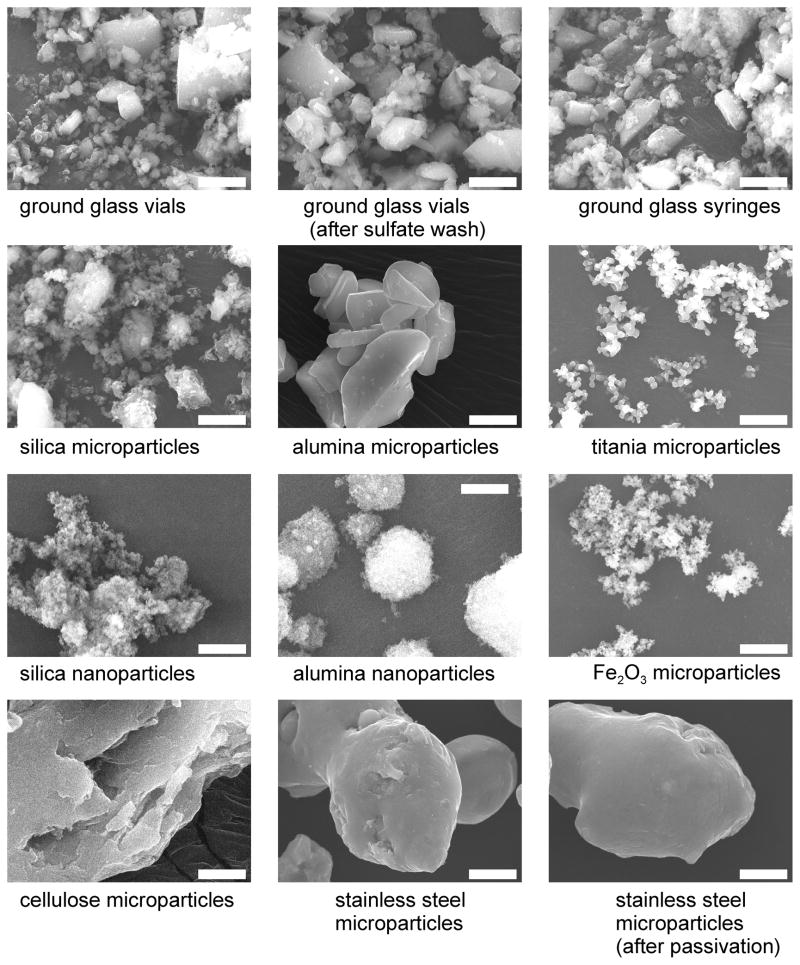
Therapeutic proteins are exposed to various wetted surfaces that could shed subvisible particles. In this work we measured the adsorption of a monoclonal antibody (mAb) to various microparticles, characterized the adsorbed mAb secondary structure, and determined the reversibility of adsorption. We also developed and used a front-face fluorescence quenching method to determine that the mAb tertiary structure was near-native when adsorbed to glass, cellulose, and silica. Initial adsorption to each of the materials tested was rapid. During incubation studies, exposure to the air-water interface was a significant cause of aggregation but acted independently of the effects of microparticles. Incubations with glass, cellulose, stainless steel, or Fe(2)O(3) microparticles gave very different results. Cellulose preferentially adsorbed aggregates from solution. Glass and Fe(2)O(3) adsorbed the mAb but did not cause aggregation. Adsorption to stainless steel microparticles was irreversible, and caused appearance of soluble aggregates upon incubation. The secondary structure of mAb adsorbed to glass and cellulose was near-native. We suggest that the protocol described in this work could be a useful preformulation stress screening tool to determine the sensitivity of a therapeutic protein to exposure to common surfaces encountered during processing and storage.
Figures
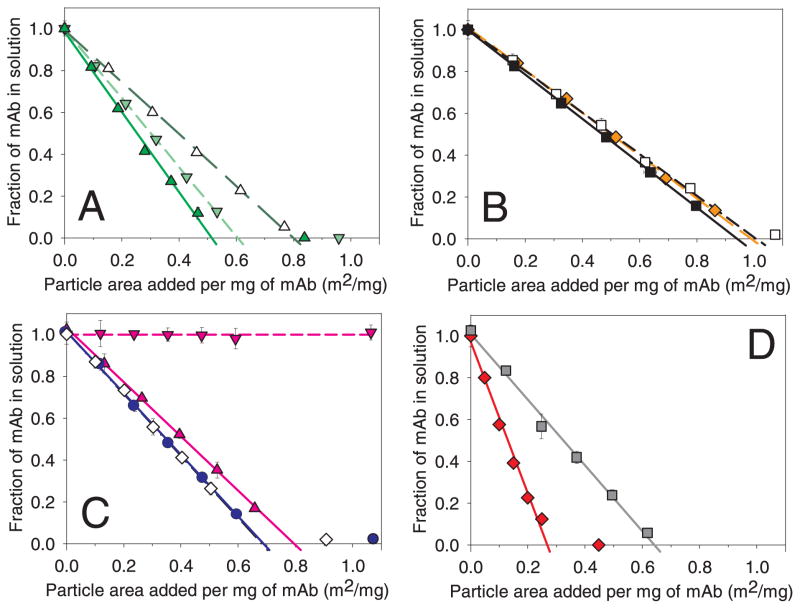
 ); glass syringes (
 ); sulfate-washed glass vials (△). Panel B: stainless steel microparticles (■); stainless steel microparticles after passivation treatment (□); Fe2O3 microparticles (
 ). Panel C: silica microparticles (
 ); silica nanoparticles (◇); alumina microparticles (
 ); alumina nanoparticles (
 ). Panel D: cellulose microparticles (
 ); titania microparticles (
 ). We also collected an additional data point, where more microparticles than necessary to adsorb 100% of the mAb were added, to confirm that excess microparticles would remove all of the protein from solution (this data point was not used in the footprint calculation). Data points are means ± SD for separate triplicate samples and lines are regressions of the average data. Error bars may be obscured by symbols. The color version of this figure can be accessed in the online article.
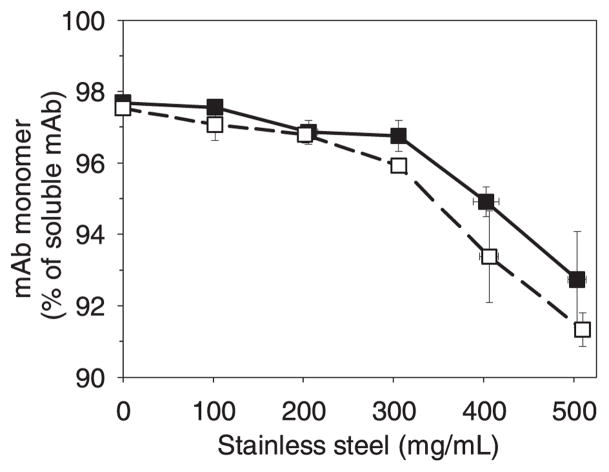
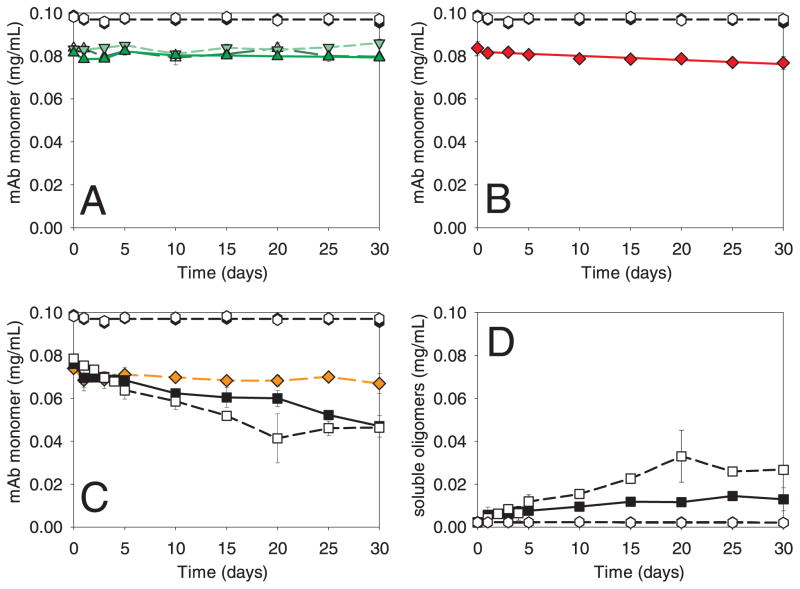 ); mAb agitated with glass syringes (); mAb agitated with sulfate-washed glass vials (
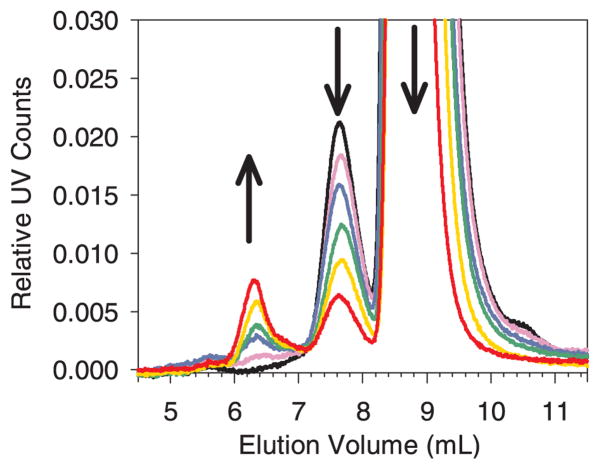
 ). Panel B: mAb agitated with cellulose (). Panel C: mAb agitated with stainless steel (■); mAb agitated with stainless steel after passivation treatment (□), mAb agitated with Fe2O3 (). Panel D: soluble aggregates after agitation with stainless steel (■); soluble aggregates after agitation with stainless steel after passivation treatment (□). Data points are means ± SD for separate triplicate samples. Error bars may be obscured by symbols. Some symbols may overlay. The color version of this figure can be accessed in the online article.
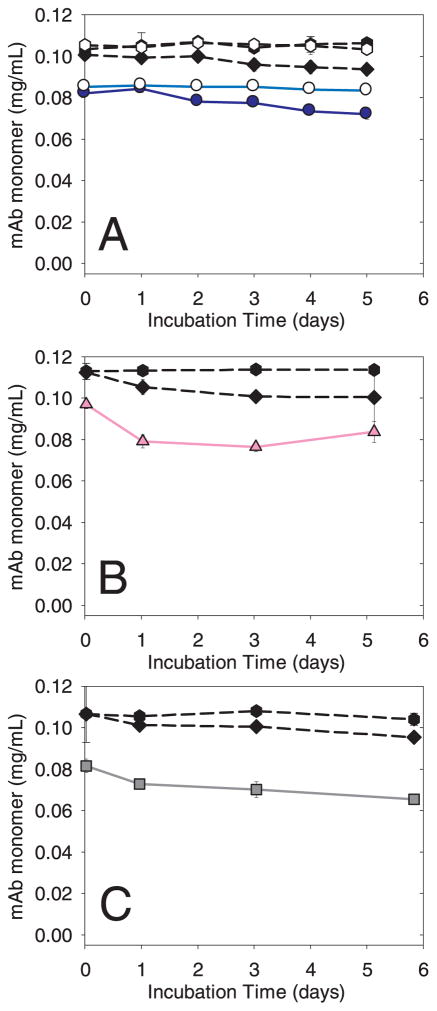 ); mAb agitated with silica microparticles without headspace (○). Panel B: mAb agitated with alumina microparticles with headspace (); Panel C: mAb agitated with titania microparticles with headspace (). Data points are means ± SD for separate triplicate samples. Error bars may be obscured by symbols. The color version of this figure can be accessed in the online article.
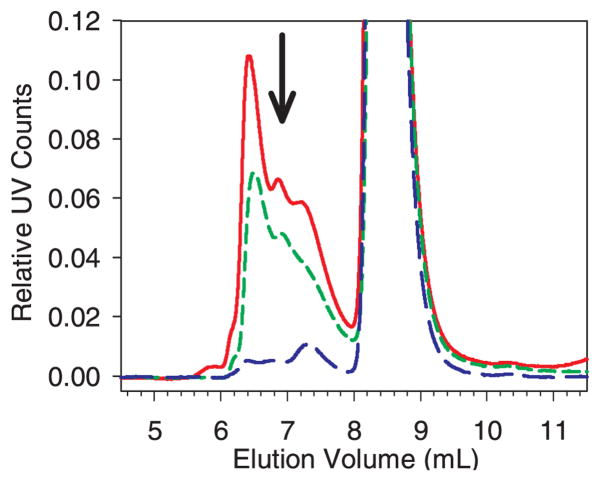
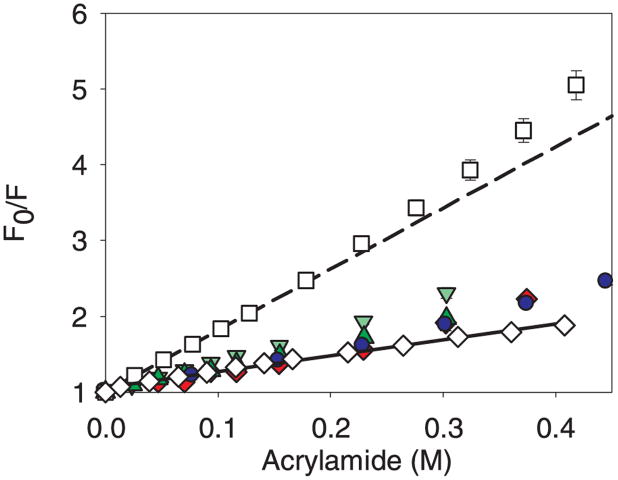 ); mAb adsorbed to ground glass syringes (); mAb adsorbed to cellulose (); mAb adsorbed to silica (). Data points are mean ± SD for 3 separate experiments. Error bars may be obscured by data points, and some data symbols overlay. The color version of this figure can be accessed in the online article.
References
-
- Schellekens H. Immunogenicity of therapeutic proteins: Clinical implications and future prospects. Clinical Therapeutics. 2002;24(11):1720–1740. - PubMed
-
- Dintzis RZ, Okajima M, Middleton MH, Greene G, Dintzis HM. The Immunogenicity of Soluble Haptenated Polymers Is Determined by Molecular Mass and Hapten Valence. Journal of Immunology. 1989;143(4):1239–1244. - PubMed
-
- Bachmann MF, Zinkernagel RM. Neutralizing antiviral B cell responses. Annual Review of Immunology. 1997;15:235–270. - PubMed
-
- Chi EY, Weickmann J, Carpenter JF, Manning MC, Randolph TW. Heterogeneous nucleation-controlled particulate formation of recombinant human platelet-activating factor acetylhydrolase in pharmaceutical formulation. Journal of Pharmaceutical Sciences. 2005;94(2):256–274. - PubMed
Publication types
MeSH terms
Substances
Grants and funding
LinkOut - more resources
Full Text Sources
Other Literature Sources
