. 2009 Oct;22(5):611-22.
doi: 10.1111/j.1755-148X.2009.00584.x. Epub 2009 May 26.

Comparison of melanoblast expression patterns identifies distinct classes of genes

Affiliations

Comparison of melanoblast expression patterns identifies distinct classes of genes

Stacie K Loftus et al. Pigment Cell Melanoma Res. 2009 Oct.

Abstract

A full understanding of transcriptional regulation requires integration of information obtained from multiple experimental datasets. These include datasets annotating gene expression within the context of an entire organism under normal and genetically perturbed conditions. Here we describe an expression dataset annotating pigment cell-expressed genes of the developing melanocyte and retinal pigmented epithelium lineages. Expression images are annotated and available at http://research.nhgri.nih.gov/manuscripts/Loftus/March2009/. Data are also summarized in a standardized manner using a universal melanoblast scoring scale that accounts for the embryonic location of cells and regional cell density. This approach allowed us to classify 14 pigment genes into four groupings classified by cell lineage expression, temporal-spatial context, and differential alteration in response to altered MITF and SOX10 status. Significant differences in regional populations were also observed across inbred strain backgrounds, highlighting the value of this approach to identify modifier allele influences on melanoblast number and distributions. This analysis revealed novel features of in vivo expression patterns that are not measurable by in vitro-based assays, providing data that in combination with genomic analyses will allow modeling of pigment cell gene expression in development and disease.


Figures

Figure 1
Figure 1. In vivo developmental expression profiles of pigment cell-expressed genes
The whole mount in situ patterns of expression allow categorization of the fourteen pigmentation genes into four lineage-restricted expression pattern groups. (A) Class I expression, represented by Tyr, displays a melanoblast- and RPE-positive pattern (Mitf, Dct, Si, Gpnmb, and Slc45a2 data not shown). (B) Class IIa expression, represented by Kit, displays a melanoblast-positive, RPE-negative early PNS-negative pattern. (C) Class IIb expression, represented by Ednrb, displays a melanoblast-positive, RPE-negative, and early PNS-positive pattern (Sox10 and Erbb3 data not shown). (D) Class III expression, represented by Trpm1, displays a melanoblast-negative, RPE-positive pattern (Rab38, Mlana and Tyrp1 data not shown). All images are of C57BL/6J, E11.5 embryos. Scale bars = 500μm. Data not shown is available at http://research.nhgri.nih.gov/manuscripts/Loftus/March2009/.
Figure 2
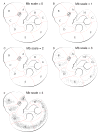
Figure 2. Embryonic Melanoblast Density Scale (MDS)
Graphical representation of the standardized MDS utilized to describe the pattern of in situ gene expression within eight defined regions of the mouse embryo. The eight regions are denoted by red dotted lines and labeled A-H in a rostral to caudal manner along E11.5 mouse embryos. Each region was scored independently for each embryo using a scale of 0–4 as defined by the following template images: (A) Mb scale =0, no expression. (B) Mb scale = 1, low expression corresponding to less than 12 positive cells within the region. (C) Mb scale =2, moderate number of melanoblasts, sparsely distributed. (D) Mb scale =3, even and numerous melanoblast positive cells. (E) Mb scale =4, extremely dense and overlapping pattern.
Figure 3
Figure 3. Transcription factor mutants subdivide in vivo pigment gene expression groups
The Mb-positive cell distribution scores for the Class I, IIa and III pigment cell-expressed genes are sorted by genotype and summarized by heatmap visualization. For each gene, 2 or more embryos were scored for both right and left sides using the MDS outlined in Figure 2. Then all MDS values for each gene were averaged and converted to a white=(0) to dark purple=(4) visualization gradient, indicating Mb cell density within a region. For Class I and IIa genes, expression was analyzed in C57BL/6J wildtype embryos and Mitf and Sox10 transcription factor deficient embryos (Mitfmi/+, Mitfmi/mi Sox10tm1Weg/+, and Sox10tm1Weg/tm1Weg, respectively) at E11.5. For Class III genes, which are only expressed in the RPE, analysis was performed on wildtype, Mitfmi/+, and Mitfmi/mi embryos, as Sox10 is not expressed in the RPE. The presence of gene expression in the developing eye is denoted by grey, and the absence of expression by white in the far right column.
Figure 4
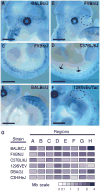
Figure 4. Regional variation in Si expression is dependant on inbred strain background
The number of Si-positive melanoblasts in an E11.5 embryo varies in both a region- and inbred strain-specific manner. Representative images illustrate the observed variation in Si-positive melanoblasts (panels A, B) at the boundary between the telencephalon and nasal process located in MDS region A; (panels C, D) the melanoblasts in the embryonic trunk within MDS region F and (panels E, G) melanoblasts in the distal tail within MDS region H. Regions in which Si-positive melanoblasts are absent/reduced are indicated by dotted lines. Arrows indicate areas within the trunk that display a localized reduction in melanoblast numbers. (panel G) MDS heatmap summary for numerical MDS values presented in Table 1 of Si-positive melanoblast expression by region for the six inbred strains indicated. N=4 embryos/strain. Scale bar =500μm.
Figure 5
Figure 5. RPE-expressed gene groups are defined based upon modulation of MITF expression
A) Whole mount in situ RPE gene expression at E11.5 on wild-type (row 1), Mitfmi/+(row 2), and Mitfmi/mi (row 3) embryos. The eleven genes compared are annotated across the top of the columns. Sox10 is not expressed in the RPE, and therefore allows visualization of the reduced pigmentation observed in the Mitfmi/+and Mitfmi/mi backgrounds. B) Variation in gene expression, in response to reduced functional MITF, further defines the expression of these eleven genes into five distinct MITF expression response categories. RPE Group 1: Mitf, Rab38, and Trpm1; RPE Group 2: Dct; RPE Group 3: Slc45A2 and Tyr; RPE Group 4 Gpnmb, Mlana, and Si; and RPE Group 5: Tyrp1.

References

    1. Amiel J, Watkin PM, Tassabehji M, Read AP, Winter RM. Mutation of the MITF gene in albinism-deafness syndrome (Tietz syndrome) Clin Dysmorphol. 1998;7:17–20. - PubMed
    1. Asher JH, Jr, Harrison RW, Morell R, Carey ML, Friedman TB. Effects of Pax3 modifier genes on craniofacial morphology, pigmentation, and viability: a murine model of Waardenburg syndrome variation. Genomics. 1996;34:285–298. - PubMed
    1. Baxter LL, Hou L, Loftus SK, Pavan WJ. Spotlight on spotted mice: a review of white spotting mouse mutants and associated human pigmentation disorders. Pigment Cell Res. 2004;17:215–224. - PubMed
    1. Baxter LL, Pavan WJ. The oculocutaneous albinism type IV gene Matp is a new marker of pigment cell precursors during mouse embryonic development. Mech Dev. 2002;116:209–212. - PubMed
    1. Baxter LL, Pavan WJ. Pmel17 expression is Mitf-dependent and reveals cranial melanoblast migration during murine development. Gene Expr Patterns. 2003;3:703–707. - PubMed

Publication types

MeSH terms

Substances