. 2009 Aug;297(2):F350-61.
doi: 10.1152/ajprenal.90765.2008. Epub 2009 Jun 3.

Differential regulation of the renal sodium-phosphate cotransporters NaPi-IIa, NaPi-IIc, and PiT-2 in dietary potassium deficiency

Affiliations

Differential regulation of the renal sodium-phosphate cotransporters NaPi-IIa, NaPi-IIc, and PiT-2 in dietary potassium deficiency

Sophia Y Breusegem et al. Am J Physiol Renal Physiol. 2009 Aug.

Abstract

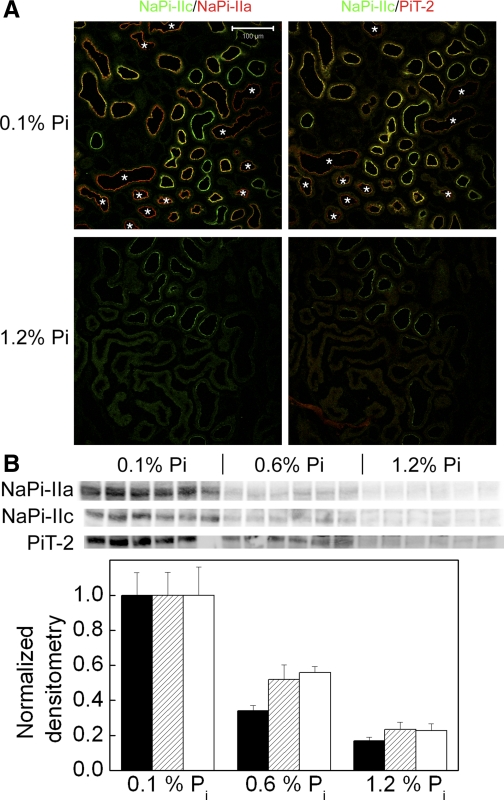
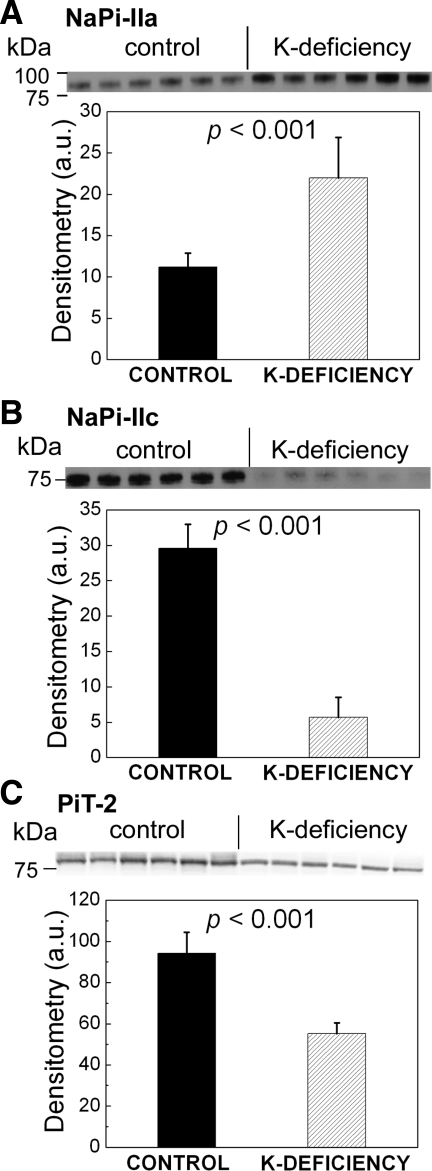
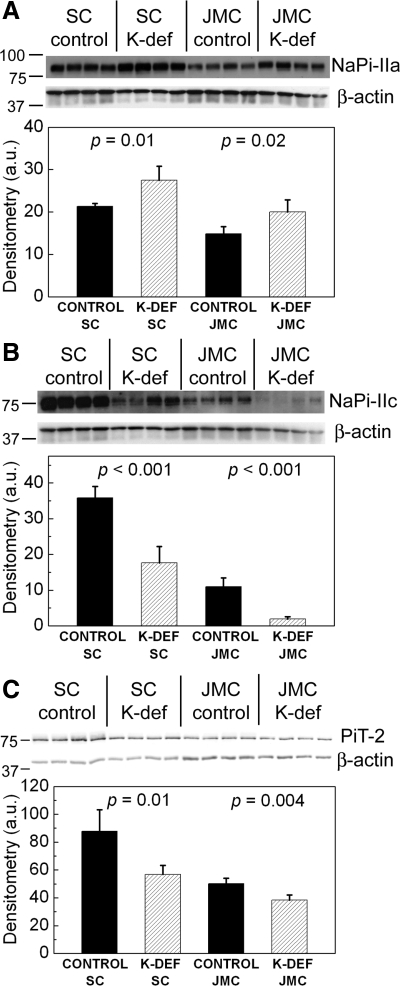
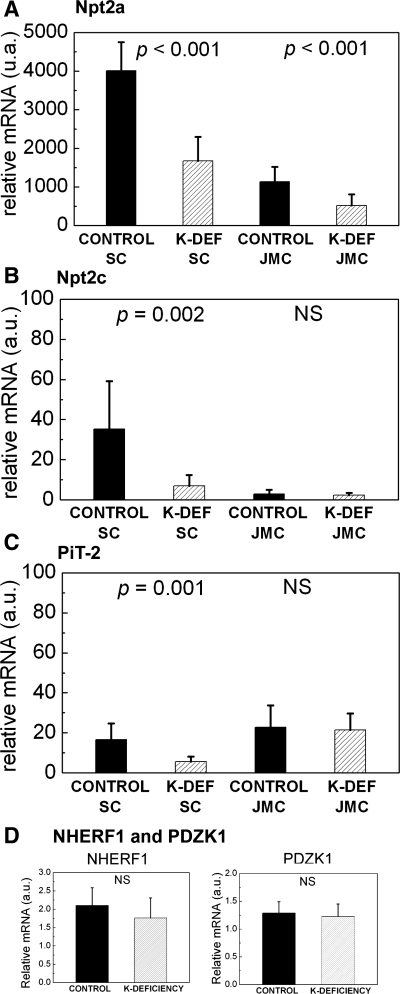
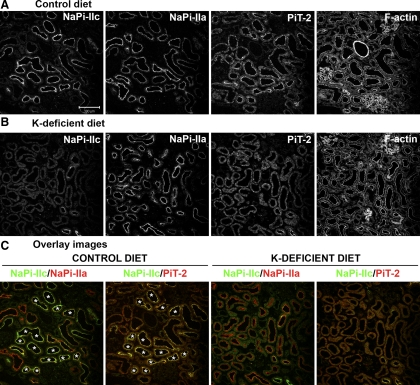
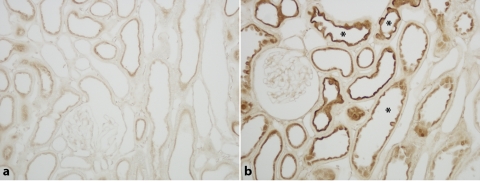
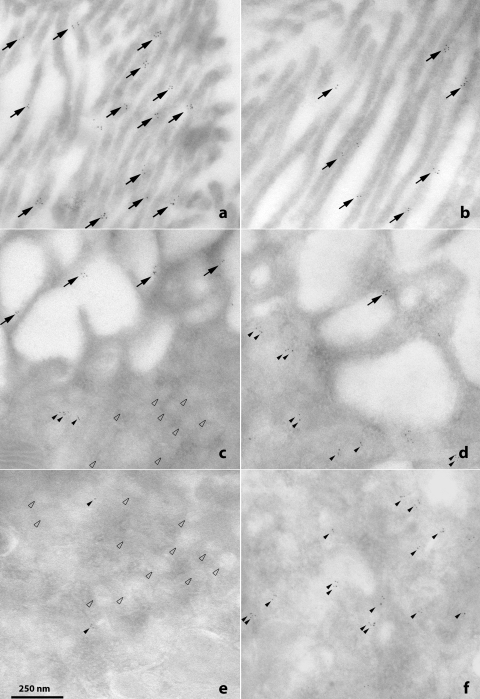
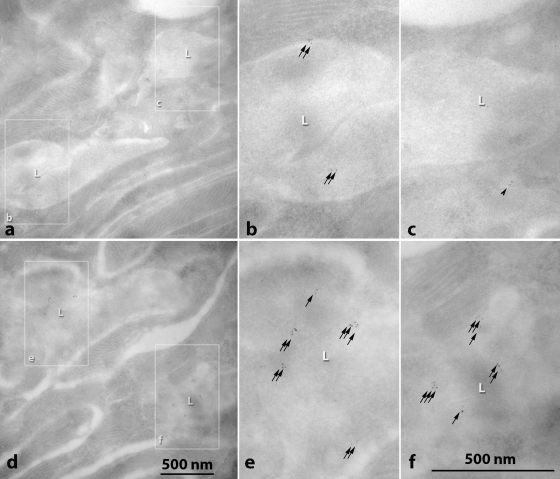
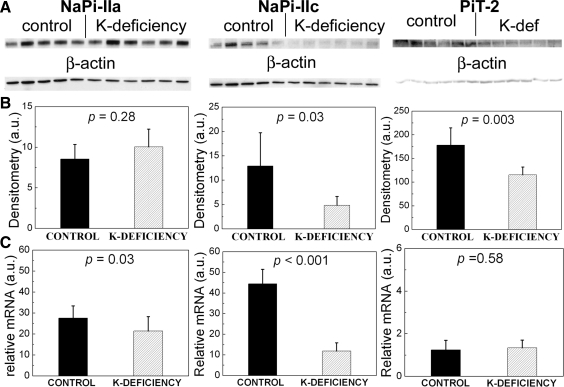
Dietary potassium (K) deficiency is accompanied by phosphaturia and decreased renal brush border membrane (BBM) vesicle sodium (Na)-dependent phosphate (P(i)) transport activity. Our laboratory previously showed that K deficiency in rats leads to increased abundance in the proximal tubule BBM of the apical Na-P(i) cotransporter NaPi-IIa, but that the activity, diffusion, and clustering of NaPi-IIa could be modulated by the altered lipid composition of the K-deficient BBM (Zajicek HK, Wang H, Puttaparthi K, Halaihel N, Markovich D, Shayman J, Beliveau R, Wilson P, Rogers T, Levi M. Kidney Int 60: 694-704, 2001; Inoue M, Digman MA, Cheng M, Breusegem SY, Halaihel N, Sorribas V, Mantulin WW, Gratton E, Barry NP, Levi M. J Biol Chem 279: 49160-49171, 2004). Here we investigated the role of the renal Na-P(i) cotransporters NaPi-IIc and PiT-2 in K deficiency. Using Western blotting, immunofluorescence, and quantitative real-time PCR, we found that, in rats and in mice, K deficiency is associated with a dramatic decrease in the NaPi-IIc protein abundance in proximal tubular BBM and in NaPi-IIc mRNA. In addition, we documented the presence of a third Na-coupled P(i) transporter in the renal BBM, PiT-2, whose abundance is also decreased by dietary K deficiency in rats and in mice. Finally, electron microscopy showed subcellular redistribution of NaPi-IIc in K deficiency: in control rats, NaPi-IIc immunolabel was primarily in BBM microvilli, whereas, in K-deficient rats, NaPi-IIc BBM label was reduced, and immunolabel was prevalent in cytoplasmic vesicles. In summary, our results demonstrate that decreases in BBM abundance of the phosphate transporter NaPi-IIc and also PiT-2 might contribute to the phosphaturia of dietary K deficiency, and that the three renal BBM phosphate transporters characterized so far can be differentially regulated by dietary perturbations.


Figures

Fig. 1.
Fig. 1.
Pi cotransporter-2 (PiT-2) expression in the proximal tubule brush border membrane (BBM) is regulated by dietary Pi in both rats and mice. A: immunofluorescence of kidney sections from rats chronically fed a low- (0.1%) or high-Pi (1.2%) diet. Parallel sections are shown, stained for sodium-coupled Pi transporter-IIc (NaPi-IIc; pseudocolored green) and NaPi-IIa (red), or NaPi-IIc (green) and PiT-2 (red). For each combination, image acquisition parameters were identical for the rat fed the low- or high-Pi diet. When rats are fed a low-Pi diet, PiT-2 expression in the renal BBM is upregulated and detected in all segments of the proximal tubule (compare with Fig. 6C), including in the S3 segments indicated by asterisks. In contrast, high-dietary Pi decreases the expression levels of NaPi-IIa and PiT-2 to background levels using the image acquisition parameters used for the animal on a low-Pi diet. The scale bar represents 100 μm. B: Western blotting of renal BBM isolated from mice chronically fed a low-Pi (0.1%) diet, a normal Pi (0.6%) diet, or a high-Pi (1.2%) diet and probed for NaPi-IIa, NaPi-IIc, PiT-2, and β-actin (not shown). The BBM abundance of all three transporters is downregulated as the dietary Pi content is increased. Densitometry values were normalized to the low-Pi diet values and are plotted ± SD. Solid bars, NaPi-IIa; hatched bars, NaPi-IIc; open bars, PiT-2.
Fig. 2.
Fig. 2.
Renal BBM Na+-coupled phosphate transporters in dietary potassium (K) deficiency in rats. NaPi-IIa abundance increases, while NaPi-IIc and PiT-2 abundance decreases in K-deficient vs. control rat BBM. NaPi-IIa (A), NaPi-IIc (B), and PiT-2 (C) abundance in 6 control and 6 K-deficient rat BBM samples was determined by Western blotting. The bar graphs show average densitometry values ± SD. The experiment was repeated three times, and a representative Western blot and analysis is shown.
Fig. 3.
Fig. 3.
Na/H exchanger regulating factor-1 (NHERF-1) and PDZK1 (NHERF-3) protein abundance in renal BBM in dietary K deficiency in the rat. Western blotting of total kidney BBM isolated from control and K-deficient rats indicates a significant decrease in one of the two bands observed for NHERF-1. A small, but statistically not significant, decrease in PDZK1 BBM abundance is also measured.
Fig. 4.
Fig. 4.
Both superficial cortex (SC) and juxtamedullary cortex (JMC) BBM show increased NaPi-IIa and decreased NaPi-IIc and PiT-2 abundance in K-deficient rats compared with control rats. SC and JMC BBM samples from 4 rats on a K-deficient diet and from 4 rats on a control diet were separated by SDS-PAGE and probed for NaPi-IIa and β-actin (A), NaPi-IIc and β-actin (B), and PiT-2 and β-actin (C). The bar graphs show average densitometry values ± SD. The experiment was repeated three times, and a representative Western blot and analysis is shown. au, Arbitrary units.
Fig. 5.
Fig. 5.
K deficiency leads to decreases in Npt2a, Npt2c, and PiT-2 mRNA levels in the rat kidney. Npt2a (A), Npt2c (B), and PiT-2 (C) mRNA levels in SC and JMC kidney homogenates were quantified by quantitative PCR, as detailed in materials and methods. Npt2a transcript amounts are decreased significantly in both SC and JMC, while Npt2c and PiT-2 transcript levels are decreased in SC only. Nonsignificant (NS) indicates P values > 0.05. D: rat kidney mRNA levels of NHERF-1 and NHERF-3 are not altered with dietary K deficiency.
Fig. 6.
Fig. 6.
Immunofluorescence imaging of NaPi-IIa, NaPi-IIc, and PiT-2 in kidney sections from K-deficient and control rats. Rat kidneys were perfuse fixed, as detailed in materials and methods, before sectioning. A first section was stained simultaneously for NaPi-IIc (chicken antibody, detected using Alexa Fluor 488-conjugated goat anti-chicken antibodies), NaPi-IIa (rabbit antibody, detected using Alexa Fluor 568 goat anti-rabbit antibodies), and F-actin (detected using Alexa Fluor 633-conjugated phalloidin), while a parallel section was stained simultaneously for NaPi-IIc, PiT-2, and F-actin using the same secondary detection reagents. Shown are representative images from a control (A) and K-deficient (B) rat in gray scale. The NaPi-IIa and NaPi-IIc images are from the first section, whereas the PiT-2 and F-actin images are from the parallel section. Significant decreases in BBM NaPi-IIc and PiT-2 staining can be observed in dietary K deficiency. C: overlay images of NaPi-IIa and NaPi-IIc or of NaPi-IIc and PiT-2, as indicated. In all images, NaPi-IIc is pseudocolored green, while NaPi-IIa or PiT-2 are pseudocolored red. The images of the control animal illustrate the overlap of NaPi-IIc and PiT-2 staining at the BBM of S1 proximal tubules (yellow in the NaPi-IIc/PiT-2 overlay image, segments indicated by asterisks), as well as the differential distribution of NaPi-IIa and NaPi-IIc (NaPi-IIc predominantly in S1, indicated by asterisks). The scale bar represents 100 μm.
Fig. 7.
Fig. 7.
Increase in NaPi-IIa BBM abundance in dietary K deficiency detected by immunohistochemistry. Light micrographs illustrate NaPi-IIa immunoreactivity in kidney sections of control (a) and K-deficient (b) rat kidney detected using immunoperoxidase cytochemisty. NaPiIIa immunoreactivity was present in the brush border of proximal tubules in both conditions, but was more intense in K-deficient animals than in controls. Also, in K-deficient animals, the undulations of the luminal surface of many proximal tubules (*) were exaggerated compared with controls, due to increased variation in cell height.
Fig. 8.
Fig. 8.
Representative high magnification transmission electron micrographs of proximal tubule cells in the S1 segment of control (a, c, and e) and K-deficient (b, d, and f) rats labeled for NaPi-IIc using immunogold cytochemistry. Three sections of the cell are shown: the brush border (a and b), the base of the microvilli and the subapical region (c and d), and cytoplasmic vesicles deeper inside the cell (e and f). In control rats, NaPi-IIc immunogold labeling was strong in the brush border (a, arrows) and was present in large vesicles and apical pits at the base of the brush border (c, arrows), but few gold particles (black arrowheads) were associated with the small cytoplasmic vesicles, either in the subapical region (c) or deeper in the cell body (e). The majority of small cytoplasmic vesicles in control rats had no NaPi-IIc immunolabel (open arrowheads, c and e). By comparison, relatively few gold particles labeling NaPi-IIc were present in the brush border of K-deficient rats (b, arrows). However, in K-deficient rats, although label was still observed in the large vesicles and apical pits at the base of the brush border (d, arrow), the NaPi-IIc immunogold labeling was markedly increased in small cytoplasmic vesicles (black arrowheads) in both the subapical region (d) and deeper in the cell (f).
Fig. 9.
Fig. 9.
Transmission electron micrographs illustrating NaPi-IIc immunolabel in lysosomes of S1 segment proximal tubule cells from control (ac) and K-deficient (df) rats. In a (control) and d (K deficient), areas containing lysosomes (L) are denoted by white rectangles and illustrated at high magnification in subsequent panels, with correlating letters (control, b and c; K deficient, e and f). In control rats, only occasional gold particles were found in lysosomes (b, arrows) or in small vesicles in the vicinity of lysosomes (c, arrowhead), whereas the majority of lysosomes were not labeled (c). In K-deficient rats, NaPi-IIc immunolabel was more prevalent in lysosomes (e and f, arrows) compared with control rats.
Fig. 10.
Fig. 10.
Dietary K deficiency in mice: BBM protein levels and mRNA of the Na+-Pi transporters NaPi-IIa, NaPi-IIc, and PiT-2. A: NaPi-IIa, NaPi-IIc, and PiT-2 protein in the renal BBM isolated from control and K-deficient mice as determined by Western blotting. The corresponding β-actin levels are also shown. B: densitometric analysis of the Pi transporter data presented in A. From left to right: NaPi-IIa, NaPi-IIc, and PiT-2. P values for control vs. K deficiency are indicated and indicate significant decreases in BBM NaPi-IIc and PiT-2 in dietary K deficiency. C: from left to right: Npt2a, Npt2c, and PiT-2 mRNA levels in total kidney homogenates from control and K-deficient mice. Significant decreases in transcript levels are observed for Npt2a and Npt2c.

Similar articles

Cited by

References

    1. Ambuhl PM, Zajicek HK, Wang H, Puttaparthi K, Levi M. Regulation of renal phosphate transport by acute and chronic metabolic acidosis in the rat. Kidney Int 53: 1288–1298, 1998. - PubMed
    1. Bacconi A, Virkki LV, Biber J, Murer H, Forster IC. Renouncing electroneutrality is not free of charge: switching on electrogenicity in a Na+-coupled phosphate cotransporter. Proc Natl Acad Sci USA 102: 12606–12611, 2005. - PMC - PubMed
    1. Beck L, Karaplis AC, Amizuka N, Hewson AS, Ozawa H, Tenenhouse HS. Targeted inactivation of Npt2 in mice leads to severe renal phosphate wasting, hypercalciuria, and skeletal abnormalities. Proc Natl Acad Sci USA 95: 5372–5377, 1998. - PMC - PubMed
    1. Bergwitz C, Roslin NM, Tieder M, Loredo-Osti JC, Bastepe M, Abu-Zahra H, Frappier D, Burkett K, Carpenter TO, Anderson D, Garabedian M, Sermet I, Fujiwara TM, Morgan K, Tenenhouse HS, Juppner H. SLC34A3 mutations in patients with hereditary hypophosphatemic rickets with hypercalciuria predict a key role for the sodium-phosphate cotransporter NaPi-IIc in maintaining phosphate homeostasis. Am J Hum Genet 78: 179–192, 2006. - PMC - PubMed
    1. Biber J, Custer M, Werner A, Kaissling B, Murer H. Localization of NaPi-1, a Na/Pi cotransporter, in rabbit kidney proximal tubules. II. Localization by immunohistochemistry. Pflügers Arch 424: 210–215, 1993. - PubMed

Publication types

MeSH terms

Substances