. 2009 Aug;150(4):2030-44.
doi: 10.1104/pp.109.140483. Epub 2009 Jun 3.

Genome-wide analysis of plastid gene expression in potato leaf chloroplasts and tuber amyloplasts: transcriptional and posttranscriptional control

Affiliations

Genome-wide analysis of plastid gene expression in potato leaf chloroplasts and tuber amyloplasts: transcriptional and posttranscriptional control

Vladimir T Valkov et al. Plant Physiol. 2009 Aug.

Abstract

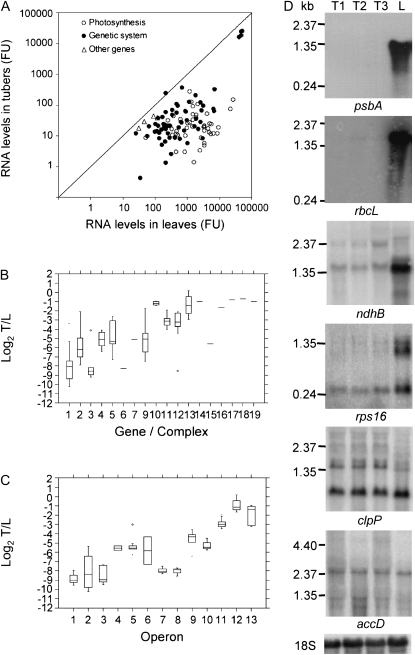
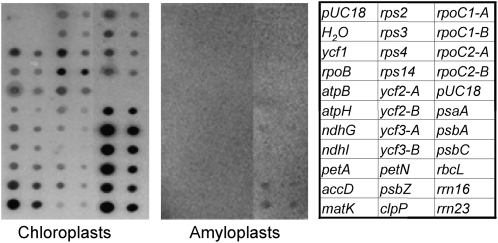
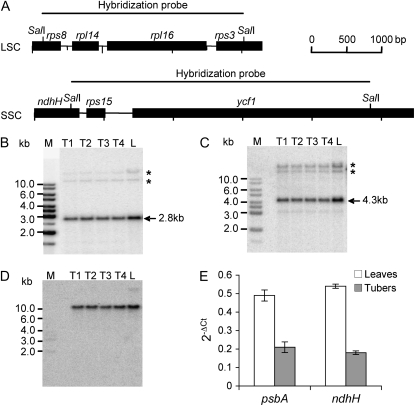
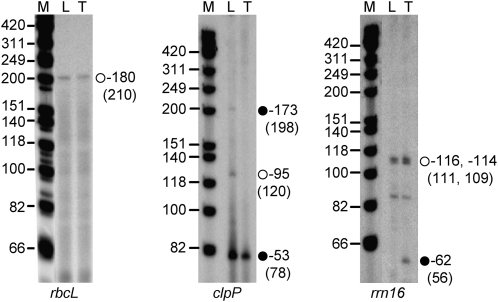
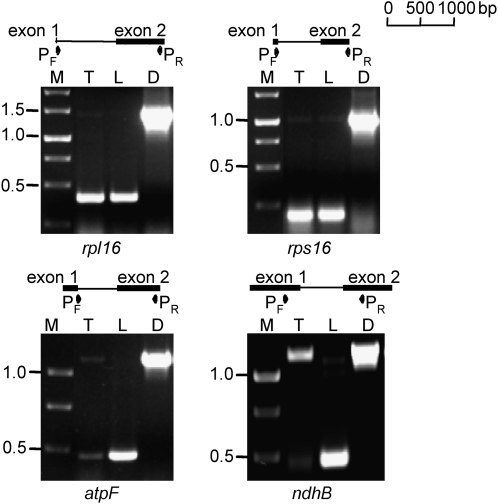
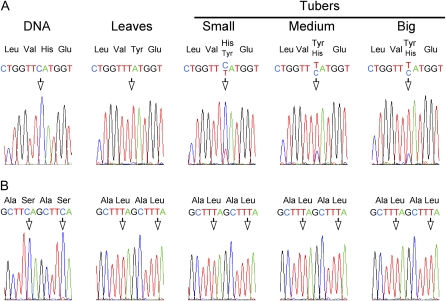
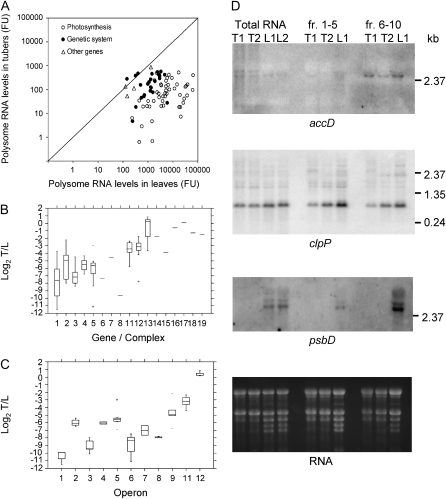
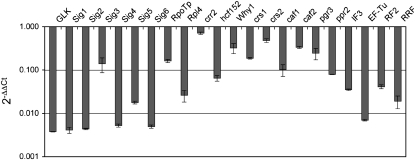
Gene expression in nongreen plastids is largely uncharacterized. To compare gene expression in potato (Solanum tuberosum) tuber amyloplasts and leaf chloroplasts, amounts of transcripts of all plastid genes were determined by hybridization to plastome arrays. Except for a few genes, transcript accumulation was much lower in tubers compared with leaves. Transcripts of photosynthesis-related genes showed a greater reduction in tubers compared with leaves than transcripts of genes for the genetic system. Plastid genome copy number in tubers was 2- to 3-fold lower than in leaves and thus cannot account for the observed reduction of transcript accumulation in amyloplasts. Both the plastid-encoded and the nucleus-encoded RNA polymerases were active in potato amyloplasts. Transcription initiation sites were identical in chloroplasts and amyloplasts, although some differences in promoter utilization between the two organelles were evident. For some intron-containing genes, RNA splicing was less efficient in tubers than in leaves. Furthermore, tissue-specific differences in editing of ndh transcripts were detected. Hybridization of the plastome arrays with RNA extracted from polysomes indicated that, in tubers, ribosome association of transcripts was generally low. Nevertheless, some mRNAs, such as the transcript of the fatty acid biosynthesis gene accD, displayed relatively high ribosome association. Selected nuclear genes involved in plastid gene expression were generally significantly less expressed in tubers than in leaves. Hence, compared with leaf chloroplasts, gene expression in tuber amyloplasts is much lower, with control occurring at the transcriptional, posttranscriptional, and translational levels. Candidate regulatory sequences that potentially can improve plastid (trans)gene expression in amyloplasts have been identified.


Figures

Figure 1.
Figure 1.
Transcript analysis of the plastid genome in potato tubers and leaves. A, Comparison of transcripts in leaves and tubers. Genes are grouped in three classes, as indicated in Supplemental Table S1. FU, Normalized fluorescence units. B, Box plots of log2 tuber/leaf signals from oligonucleotide arrays for different gene groups/protein complexes, as follows: 1 = psb, 2 = psa, 3 = pet, 4 = atp, 5 = ndh, 6 = rbcL, 7 = cemA, 9 = trn, 10 = rrn, 11 = rpl, 12 = rps, 13 = rpo, 14 = clpP, 15 = matK, 16 = accD, 17 = ycf1, 18 = ycf2, 19 = ycf15. C, Box plots of log2 tuber/leaf signals from oligonucleotide arrays for different operons (according to the operon structure of the tobacco plastome; Wakasugi et al., 1998), as follows: 1 = psbD-C-Z, 2 = psbE-F-L-J, 3 = psbB-T-H-petB-D, 4 = atpB-E, 5 = ndhH-A-I-G-E-psaC-ndhD, 6 = ndhC-K-J, 7 = psbK-I-trnGUCC, 8 = psaA-B-rps14, 9 = rps2-atpI-H-F-A, 10 = trnEUUC-YGUA-DGUC, 11 = rpl23-2-rps19-rpl22-rps3-rpl16-14-rps8-(ψinfA)-rps11-rpoA, 12 = rpoB-C1-C2, 13 = rrn16-trnIGAU-AUGC-rrn23-4.5-5. D, Northern-blot analyses for a subset of genes using 5 μg of total RNA from tubers at different stages of development (T1–T3, from small to big) and leaves (L). Details of array data for each gene are reported in Supplemental Table S1.
Figure 2.
Figure 2.
Run-on transcription activity for a sample of genes in leaf chloroplasts and tuber amyloplasts. Representative genes were selected on the basis of their transcript accumulation and function. Filters were spotted with PCR-amplified gene products from potato plastid DNA at two different concentrations (500 and 100 fmol), as indicated in the scheme at right, and hybridized with 32P-labeled run-on transcripts obtained with the two plastid types. Transcription in 2 × 10⁷ lysed chloroplasts or amyloplasts was allowed to proceed for 5 min in 200-μL reactions supplemented with 200 μCi of [α-32P]UTP. Labeled run-on transcripts were hybridized to the nylon filters as described in “Materials and Methods.” Fragments amplified from distinct regions of the same gene are indicated by different letters.
Figure 3.
Figure 3.
Estimation of relative plastid genome copy numbers in tubers of different developmental stages (T1–T4, from small to big) and leaves (L). A, Physical maps of the LSC and SSC in the plastid genome of potato detected by Southern-blot analyses. Restriction sites used for generation of hybridization probes are shown. B and C, The labeled probes for LSC and SSC detect 2.8-kb (B) and 4.3-kb (C) fragments, respectively, in all samples. Asterisks indicate cross-hybridizing promiscuous DNA (Li et al., 2006). M, DNA size marker. D, Hybridization with the nuclear actin gene to control for equal loading of the lanes. E, Analysis of relative ptDNA contents in leaves and tubers by qRT-PCR amplification of the potato psbA and ndhH genes, located in the LSC and SSC, respectively. Data were normalized to the amount of the nuclear 18S rRNA gene and expressed as 2−ΔCt. Error bars indicate sd.
Figure 4.
Figure 4.
Primer extension analysis to map the rrn16, clpP, and rbcL transcription initiation sites in potato tubers (T) and leaves (L). Numbers on the right indicate the distance between the transcript's 5′ end and the first nucleotide of either the coding region (rbcL and clpP) or the mature transcript (rrn16). Numbers in parentheses refer to the size of the extension products. Black circles, NEP promoter; white circles, PEP promoter. M, DNA size marker.
Figure 5.
Figure 5.
RT-PCR analysis of splicing in the rpl16, rps16, atpF, and ndhB transcripts in tubers (T) and leaves (L). D, DNA control; M, DNA size marker. Approximate locations and orientations of the primers (P) used are indicated.
Figure 6.
Figure 6.
Analysis of ndhB mRNA editing in tubers and leaves. A, While all sites were completely edited in leaves, differences in the extent of editing were observed for codon 196 in tubers of different sizes. B, Two downstream editing sites (corresponding to codons 277 and 279) covered with the same sequencing reaction did not show any difference between leaves and tubers.
Figure 7.
Figure 7.
Polysome-associated plastid transcripts in potato tubers and leaves. A, Comparison of polysome association in leaves and tubers. Genes are grouped in three classes, as indicated in Supplemental Table S2. FU, Normalized fluorescence units. B, Box plots of log2 tuber/leaf (T/L) signals from oligonucleotide arrays for different gene groups/protein complexes, as follows: 1 = psb, 2 = psa, 3 = pet, 4 = atp, 5 = ndh, 6 = rbcL, 7 = cemA, 8 = ccsA, 11 = rpl, 12 = rps, 13 = rpo, 14 = clpP, 15 = matK, 16 = accD, 17 = ycf1, 18 = ycf2, 19 = ycf15. C, Box plots of log2 tuber/leaf signals from oligonucleotide arrays for different operons (according to the operon structure in the tobacco plastome; Wakasugi et al., 1998), as follows: 1 = psbD-C-Z, 2 = psbE-F-L-J, 3 = psbB-T-H-petB-D, 4 = atpB-E, 5 = ndhH-A-I-G-E-psaC-ndhD, 6 = ndhC-K-J, 7 = psbK-I-(trnGUCC), 8 = psaA-B-rps14, 9 = rps2-atpI-H-F-A, 11 = rpl23-2-rps19-rpl22-rps3-rpl16-14-rps8-(ψinfA)-rps11-rpoA, 12 = rpoB-C1-C2. D, Northern-blot analysis of total RNA and RNA pools from different fractions after polysome separation on Suc gradients (fractions 1–5 and 6–10; see “Materials and Methods”). RNA samples from leaves (L1 and L2) or tubers (T1 and T2) were separated by electrophoresis and hybridized with 32P-labeled accD, clpP, and psbD gene-specific probes. Details of array data for each gene are reported in Supplemental Table S2.
Figure 8.
Figure 8.
Expression of representative nuclear genes involved in chloroplast biogenesis and plastid gene expression in tubers. Transcript abundance was determined by qRT-PCR and is shown, after normalization to the elongation factor1-α gene and relative to leaves, as 2−ΔΔCt. Data are represented on a logarithmic scale. Error bars indicate sd.

References

    1. Adam Z (2007) Protein stability and degradation in plastids. Top Curr Genet 19 315–338
    1. Aguettaz P, Seyer P, Pesey H, Lescure AM (1987) Relations between the plastid gene dosage and the levels of 16S rRNA and rbcL gene transcripts during amyloplast to chloroplast change in mixotrophic spinach cell suspensions. Plant Mol Biol 8 169–177 - PubMed
    1. Ahlert D, Stegemann S, Kahlau S, Ruf S, Bock R (2009) Insensitivity of chloroplast gene expression to DNA methylation. Mol Genet Genomics (in press) - PMC - PubMed
    1. Allison LA (2000) The role of sigma factors in plastid transcription. Biochimie 82 537–548 - PubMed
    1. Allison LA, Maliga P (1995) Light-responsive and transcription-enhancing elements regulate the plastid psbD core promoter. EMBO J 14 3721–3730 - PMC - PubMed

Publication types

MeSH terms

LinkOut - more resources