. 2009 Aug;83(16):8163-72.
doi: 10.1128/JVI.00629-09. Epub 2009 Jun 3.

The M10 locus of murine gammaherpesvirus 68 contributes to both the lytic and the latent phases of infection

Affiliations

The M10 locus of murine gammaherpesvirus 68 contributes to both the lytic and the latent phases of infection

B Flach et al. J Virol. 2009 Aug.

Abstract

Murine gammaherpesvirus 68 (MHV-68) is closely related to Epstein-Barr virus and Kaposi's sarcoma-associated herpesvirus (KSHV) and provides a small-animal model to study the pathogenesis of gammaherpesvirus (gammaHV) infections. According to the colinear organization of the gammaHV genomes, the M10 locus is situated at a position equivalent to the K12 locus of KSHV, which codes for proteins of the kaposin family. The M10 locus of MHV-68 has been predicted to code for three overlapping open reading frames (M10a, M10b, and M10c [M10a-c]) with unknown function. In addition, the M10 locus contains a lytic origin of replication (oriLyt). To elucidate the function of the M10 locus during lytic and latent infections, we investigated, both in vitro and in vivo, the following four recombinant viruses which were generated using MHV-68 cloned as a bacterial artificial chromosome: (i) a mutant virus with a deletion which affects both the coding region for M10a-c and the oriLyt; (ii) a revertant virus in which both the M10a-c coding region and the oriLyt were reverted to those of the wild type; (iii) a virus with an ectopic insertion of the oriLyt, which restores the function of the oriLyt but not the M10a-c coding region; and (iv) a mutant virus with a deletion in the oriLyt only. While the mutants were slightly attenuated with regard to lytic replication in cell culture, they showed severe growth defects in vivo. Both lytic replication and latency amplification were strongly reduced. In contrast, both the revertant virus and the virus with the ectopic oriLyt insertion grew very similarly to the parental wild-type virus both in vitro and in vivo. Thus, we provide genetic evidence that mutation of the oriLyt, and not of putative protein coding sequences within the M10a-c region, is responsible for the observed phenotype. We conclude that the oriLyt in the M10 locus plays an important role during infection of mice with MHV-68.


Figures
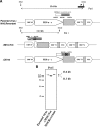
FIG. 1.
FIG. 1.
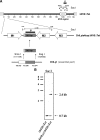
Construction and characterization of the ΔM10ΔTet and Δ201nt mutants. (A) Scheme of the mutants generated. “P” indicates the probe used for Southern blot analysis, corresponding to nucleotides 102215 to 103164. The construction and characterization of the Δ201nt mutant have been described in detail previously (3). The boxed “×” schematically represents the deletion. ORF, open reading frame. (B) Southern blot analysis of viral DNA digested with the restriction enzyme PstI and hybridized with probe P. The expected fragments are indicated by arrows on the right. Marker sizes (in kilobase pairs) are indicated on the left.
FIG. 2.
FIG. 2.
Replication in cell culture. NIH 3T3 cells were infected at an MOI of 0.1 with the indicated viruses. Cells were harvested at different time points after infection, and titers were determined on BHK-21 cells. Data shown are the means ± standard deviations from three independent experiments.
FIG. 3.
FIG. 3.
Lytic replication in the lungs after i.n. infection. C57BL/6 mice were infected i.n. with 5 × 10⁴ PFU of the indicated viruses. At day 6 after infection (A) or at the indicated time points (B), lungs were harvested, and virus titers were determined from organ homogenates by plaque assay on BHK-21 cells. Each symbol represents an individual mouse, and the bars represent the means. (A) The data are compiled from seven (parental virus), eight (ΔM10ΔTet), two (Δ201nt), and five (M10.Revertant) independent experiments; (B) the data are from a single experiment. The asterisks indicate a statistically significant difference between mutant viruses and parental and revertant viruses (P < 0.001) (A) and between mutant virus and parental virus (P = 0.003 at day 3 and P = 0.047 at day 6) (B).
FIG. 4.
FIG. 4.
Latent infection in the spleen after i.n. infection. (A) Spleen weights; (B) ex vivo reactivation of splenocytes; (C and D) viral genomic load in the spleen. C57BL/6 mice were infected i.n. with 5 × 10⁴ PFU of the indicated viruses. At day 17 (A to C) or at days 10 and 42 after infection (D), spleens were harvested, and the spleen weights were taken. Single splenocyte suspensions were prepared and analyzed in the ex vivo reactivation assay or used for DNA isolation for real-time PCR analysis. Data shown in panel A are the means ± standard deviations of the number of individual mice indicated, compiled from nine (parental virus; ΔM10ΔTet), two (Δ201nt), and four (M10.Revertant) independent experiments. The means ± standard deviations of three uninfected mice are shown for comparison. The asterisks indicate a statistical significant difference (P = 3.3 × 10⁻¹⁶ [parental virus versus ΔM10ΔTet]; P = 1.6 × 10⁻⁵ [parental virus versus Δ201nt]; P = 2.2 × 10⁻¹⁴ [ΔM10ΔTet versus M10.Revertant]; and P = 0.0003 [Δ201nt versus M10.Revertant]). Data shown in panel B are the means ± standard errors of the means pooled from eight (parental virus), nine (ΔM10ΔTet), two (Δ201nt), and four (M10.Revertant) independent experiments. In each experiment, splenocytes from three mice per group were pooled. The dashed line in panel B indicates the point of 63.2% Poisson distribution, determined by nonlinear regression, which was used to calculate the frequency of cells reactivating lytic replication. To calculate significance, frequencies of reactivation events were statistically analyzed by paired t test for all cell dilutions. The statistical significance is indicated by P values of 0.027 (parental virus versus ΔM10ΔTet), 0.021 (parental virus versus Δ201nt), 0.022 (ΔM10ΔTet versus M10.Revertant), and 0.018 (Δ201nt versus M10.Revertant). In panels C and D, each symbol represents an individual mouse, and the bars represent the means. The data in panel C are compiled from eight (parental virus), nine (ΔM10ΔTet), three (Δ201nt), and three (M10.Revertant) independent experiments, and the data in panel D are from a single experiment. The asterisks in panel C indicate statistical significance: P values of 8 × 10⁻⁷ (parental virus versus ΔM10ΔTet), 0.01 (parental virus versus Δ201nt), 8 × 10⁻⁶ (ΔM10ΔTet versus M10.Revertant), and 0.024 (Δ201nt versus M10.Revertant).
FIG. 5.
FIG. 5.
Lytic replication and latent infection in the spleen after i.p. infection. C57BL/6 mice were infected i.p. with 1 × 10⁵ PFU of the indicated viruses. (A) Spleen titer. At day 6 after infection, spleens were harvested, and virus titers were determined from organ homogenates by plaque assay on BHK-21 cells. Each symbol represents an individual mouse, and the bar represents the mean. The data were compiled from two independent experiments. The asterisk indicates a statistically significant difference (P = 0.001). (B) Ex vivo reactivation of splenocytes. At day 17 after infection, spleens were harvested, and single splenocyte suspensions were prepared and analyzed in the ex vivo reactivation assay. Data shown are the means from a single experiment, with pooled splenocytes from three mice per group. The dashed line indicates the point of 63.2% Poisson distribution, determined by nonlinear regression, which was used to calculate the frequency of cells reactivating lytic replication. To calculate significance, frequencies of reactivation events were statistically analyzed by paired t test for all cell dilutions. The statistical significance of the difference between the mutant and parental viruses is a P value of 0.07.
FIG. 6.
FIG. 6.
Construction and characterization of the OriLytΔM10ΔTet mutant. (A) Schematic map of the OriLytΔM10ΔTet mutant genome, with the ectopic insertion of the essential part of the oriLyt indicated. P, probe. (B) Southern blot analysis of viral DNA digested with the restriction enzyme SacI and hybridized with the 863-bp SmaI-EagI fragment, indicated in panel A as the probe. The expected fragments are indicated by arrows on the right. Marker sizes (in kilobase pairs) are indicated on the left.
FIG. 7.
FIG. 7.
Replication in cell culture. NIH 3T3 cells were infected at an MOI of 0.1 with the indicated viruses. Cells were harvested at different time points after infection, and titers were determined on BHK-21 cells. Data shown are the means ± standard deviations from two independent experiments.
FIG. 8.
FIG. 8.
Ectopic complementation of the oriLyt restores the phenotype of the ΔM10ΔTet mutant. C57BL/6 mice were infected i.n. with 5 × 10⁴ PFU of the indicated viruses. (A) Lytic lung titer. At day 6 after infection, lungs were harvested, and virus titers were determined from organ homogenates by plaque assay on BHK-21 cells. Each symbol represents an individual mouse, and the bars represent the means. The data are compiled from two independent experiments. The asterisk indicates a statistically significant difference (P = 0.004 [parental virus versus ΔM10ΔTet] and P = 0.016 [ΔM10ΔTet versus OriLytΔM10ΔTet]). (B) Splenomegaly; (C) ex vivo reactivation of splenocytes; (D) viral genomic load in the spleen. At day 17 after infection, spleens were harvested, and the spleen weights were taken. Single splenocyte suspensions were prepared and analyzed in the ex vivo reactivation assay or used for DNA isolation for real-time PCR analysis. Data shown in panel B are the means ± standard deviations of nine mice per group, compiled from three independent experiments. The asterisk indicates a statistically significant difference (P = 2.5 × 10⁻⁶ [parental virus versus ΔM10ΔTet] and P = 0.0029 [ΔM10ΔTet versus OriLytΔM10ΔTet]). Data shown in panel C are the means ± standard errors of the means pooled from three independent experiments. In each experiment, splenocytes from three mice per group were pooled. Serial dilutions of live, intact splenocytes were plated on NIH 3T3 indicator cells in parallel with samples that were mechanically disrupted to distinguish between virus reactivation from latency and preformed infectious virus. No preformed infectious virus was detected with any of the viruses analyzed (data not shown). The dashed line in panel C indicates the point of 63.2% Poisson distribution, determined by nonlinear regression, which was used to calculate the frequency of cells reactivating lytic replication. To calculate significance, frequencies of reactivation events were statistically analyzed by paired t test for all cell dilutions. The statistical significance is indicated by P values of 0.0177 (parental virus versus ΔM10ΔTet) and 0.004 (ΔM10ΔTet versus OriLytΔM10Δtet). In panel D, each symbol represents an individual mouse, and the bars represent the means. The data are compiled from three independent experiments. The asterisk indicates a statistically significant difference (P = 0.001 [parental virus versus ΔM10ΔTet] and P = 0.008 [ΔM10ΔTet versus OriLytΔM10ΔTet]).

Similar articles

Cited by

References

    1. Adler, H., M. Messerle, and U. H. Koszinowski. 2001. Virus reconstituted from infectious bacterial artificial chromosome (BAC)-cloned murine gammaherpesvirus 68 acquires wild-type properties in vivo only after excision of BAC vector sequences. J. Virol. 755692-5696. - PMC - PubMed
    1. Adler, H., M. Messerle, M. Wagner, and U. H. Koszinowski. 2000. Cloning and mutagenesis of the murine gammaherpesvirus 68 genome as an infectious bacterial artificial chromosome. J. Virol. 746964-6974. - PMC - PubMed
    1. Adler, H., B. Steer, K. Freimuller, and J. Haas. 2007. Murine gammaherpesvirus 68 contains two functional lytic origins of replication. J. Virol. 817300-7305. - PMC - PubMed
    1. Ahn, J. W., K. L. Powell, P. Kellam, and D. G. Alber. 2002. Gammaherpesvirus lytic gene expression as characterized by DNA array. J. Virol. 766244-6256. - PMC - PubMed
    1. AuCoin, D. P., K. S. Colletti, Y. Xu, S. A. Cei, and G. S. Pari. 2002. Kaposi's sarcoma-associated herpesvirus (human herpesvirus 8) contains two functional lytic origins of DNA replication. J. Virol. 767890-7896. - PMC - PubMed

Publication types

LinkOut - more resources