. 2009 Aug;83(16):7948-58.
doi: 10.1128/JVI.00554-09. Epub 2009 Jun 3.

Functional characterization of Negri bodies (NBs) in rabies virus-infected cells: Evidence that NBs are sites of viral transcription and replication

Affiliations

Functional characterization of Negri bodies (NBs) in rabies virus-infected cells: Evidence that NBs are sites of viral transcription and replication

Xavier Lahaye et al. J Virol. 2009 Aug.

Abstract

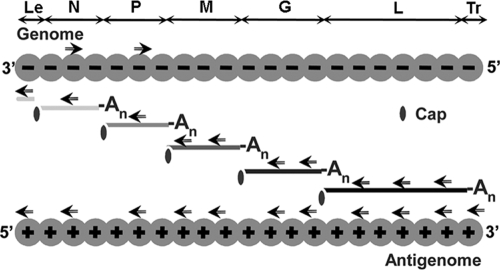
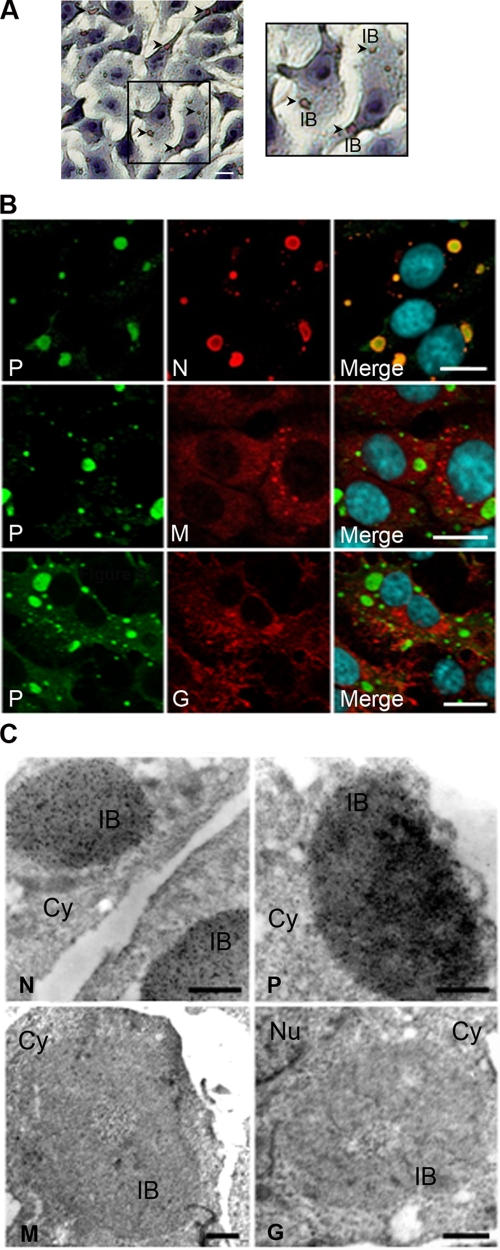
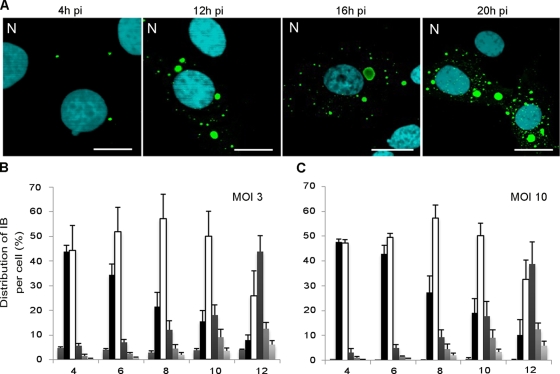
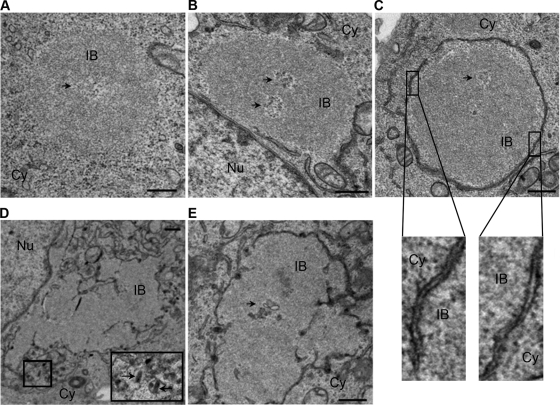
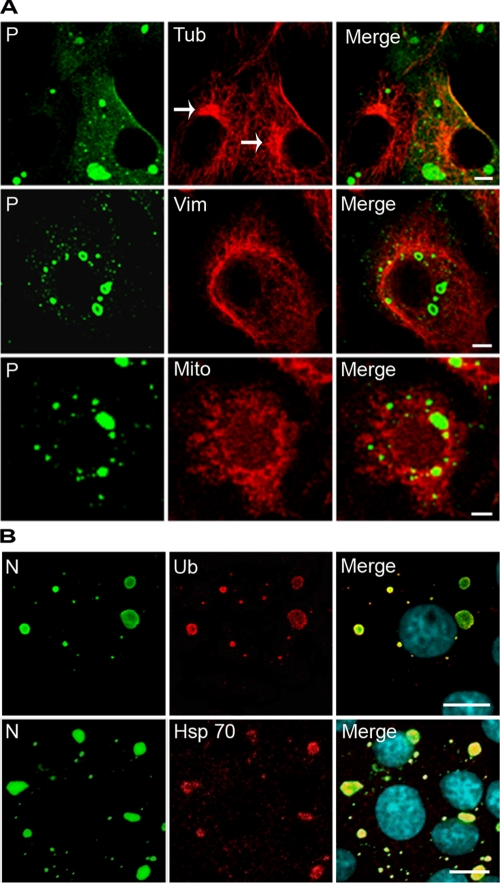
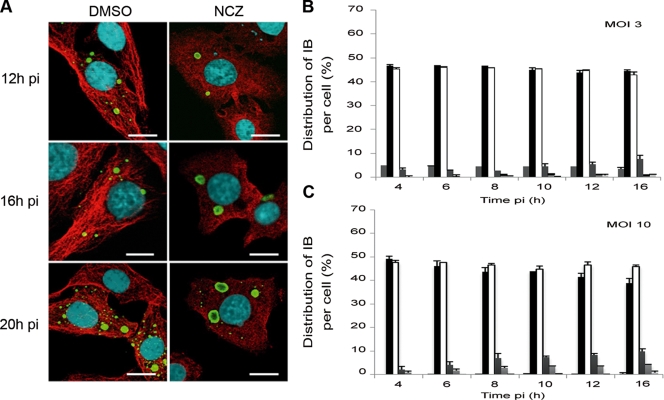
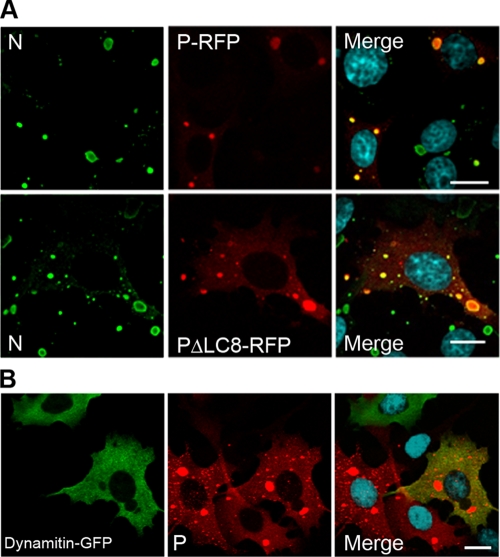
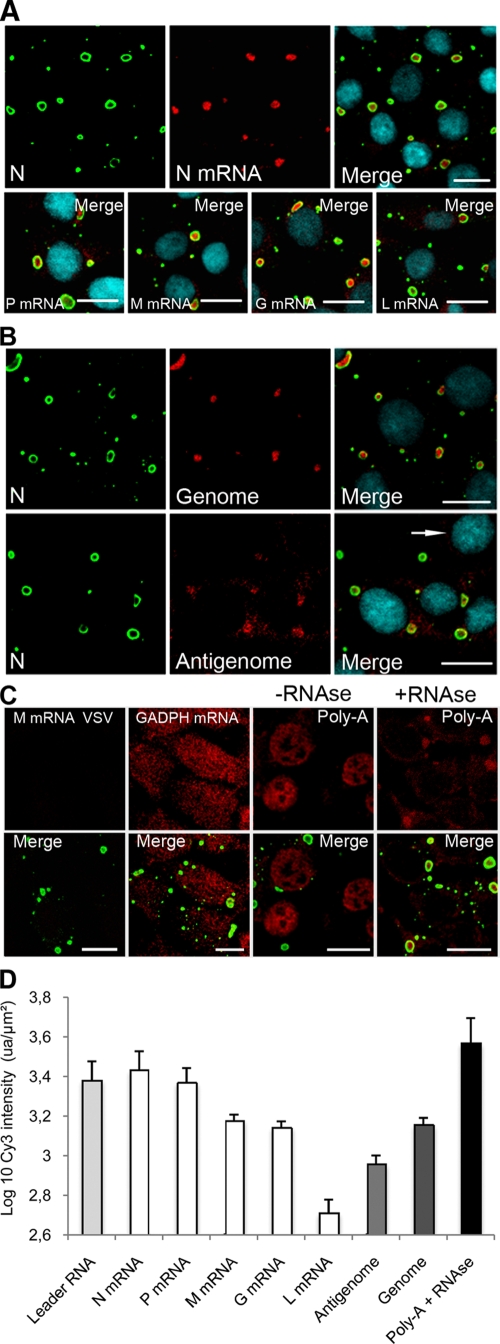
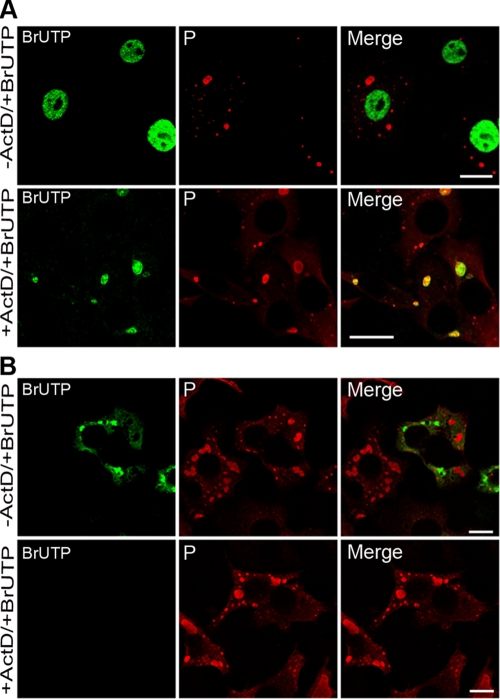
Rabies virus infection induces the formation of cytoplasmic inclusion bodies that resemble Negri bodies found in the cytoplasm of some infected nerve cells. We have studied the morphogenesis and the role of these Negri body-like structures (NBLs) during viral infection. The results indicate that these spherical structures (one or two per cell in the initial stage of infection), composed of the viral N and P proteins, grow during the virus cycle before appearing as smaller structures at late stages of infection. We have shown that the microtubule network is not necessary for the formation of these inclusion bodies but is involved in their dynamics. In contrast, the actin network does not play any detectable role in these processes. These inclusion bodies contain Hsp70 and ubiquitinylated proteins, but they are not misfolded protein aggregates. NBLs, in fact, appear to be functional structures involved in the viral life cycle. Specifically, using in situ fluorescent hybridization techniques, we show that all viral RNAs (genome, antigenome, and every mRNA) are located inside the inclusion bodies. Significantly, short-term RNA labeling in the presence of BrUTP strongly suggests that the NBLs are the sites where viral transcription and replication take place.


Figures

FIG. 1.
FIG. 1.
Rabies virus RNA species (genome, antigenome, and mRNAs encoding N, P, M, G, and L proteins) and location of sense and antisense primers (indicated by arrows) used in the FISH experiments. Abbreviations: Le, leader; Tr, trailer; An, poly(A).
FIG. 2.
FIG. 2.
Characterization of the viral IBs. (A) BSR cells were infected with rabies virus (CVS strain) at an MOI of 3 for 16 h and stained by the Sellers' staining protocol as described in Materials and Methods. Viral IBs are indicated pointed by arrows (left panel). A higher magnification of an area is also presented (right panel). The scale bar corresponds to 12 μm. (B) BSR cells were infected as described above. After fixation and permeabilization, cells were processed for double-immunofluorescence staining with a rabbit polyclonal anti-P antibody (P) and the MAb 62B5 anti-N antibody (N), a mouse polyclonal anti-M antibody (M), or the MAb 30AA5 anti-G antibody (G). In all cases, DAPI (blue) was used to stain the nuclei (merge). Colocalization is apparent as yellow coloration in the merged panel. The scale bars correspond to 12 μm. (C) Infected BSR cells as described above were treated for immunogold labeling. P protein was detected by using two MAbs, 25C2 and 30F2; N protein was detected by using MAb 64B6; and M and G proteins were detected by using mouse polyclonal anti-M antibody and by anti-G MAb 30AA5, respectively. The scale bars correspond to 0.5 μm.
FIG. 3.
FIG. 3.
Evolution of the viral IBs during the viral cycle. (A) BSR cells were infected by CVS at an MOI of 3 for different times p.i. as indicated and stained with rabbit polyclonal anti-N conjugated to FITC antibody and DAPI. The scale bars correspond to 12 μm. (B and C) The numbers of IBs per cell were quantified at different times p.i. for an MOI of 3 (B) or an MOI of 10 (C). A histogram represents the average values from three independent experiments by counting 400 cells per experiment. The results are indicated as the percentages of cells that were uninfected or that contained one, two, three, four, and more IBs and are depicted by six variously shaded columns from left to right, respectively, for each time point. Error bars indicate the standard deviations.
FIG. 4.
FIG. 4.
Morphology and evolution of viral IBs. Ultrastructural aspect of BSR cells infected for 12 h (A), 16 h (B and C), and 24 h (D and E) p.i. as indicated. Double fixation was performed with glutaraldehyde and osmium tetraoxide. Epon embedding and uranium-lead staining. IBs display a granular dense structure with a cavity (indicated by arrows in panels A, B, C, and E). Note the recruitment of membranes around IBs at 16 h p.i. (B and C) and the presence of virus particles close to the viral inclusion at 24 h p.i. (indicated by arrow in panel D). Nu, nucleus; Cy, cytoplasm. Bars correspond to 0.5 μm. Higher magnification (×13) of two membrane areas reveals a double-membrane with a granular surface are shown for panel C.
FIG. 5.
FIG. 5.
Viral IBs exhibit some features of aggresomes but are distinct structures. (A) BSR cells were infected for 16 h and costained with a rabbit polyclonal anti-P antibody (P) and either mouse anti-α tubulin MAb (Tub), mouse anti-vimentin MAb (Vim), or the MitoTracker Red (Mito), followed by incubation with Alexa 488-goat anti-rabbit IgG and Alexa 568-goat anti-mouse IgG. Note that IBs are not localized at the MTOC (indicated by arrows) and that no vimentin cage or no recruitment of mitochondria (as would be expected for aggresomes) are observed around the IBs. (B) IBs contain Hsp70 and ubiquitinylated proteins. Infected BSR cells were immunostained with a rabbit polyclonal FITC-conjugated anti-N antibody (N) and a mouse MAb anti-ubiquitin antibody (Ub) or a mouse MAb anti-Hsp70 antibody (Hsp70), followed by incubation with Alexa 568-goat anti-mouse IgG. The scale bars correspond to 12 μm.
FIG. 6.
FIG. 6.
Effect of nocodazole on formation and evolution of IBs during infection. (A) BSR cells were infected and treated with nocodazole (2 μM; NCZ) or mock treated (DMSO). At different times p.i. as indicated, the cells were costained with rabbit polyclonal anti-N conjugated to FITC antibody and with mouse MAb anti-α tubulin antibody, followed by incubation with Alexa 568-goat anti-mouse IgG. The scale bars correspond to 12 μm. (B and C) The numbers of IBs per cell were quantified in nocodazole-treated cells at different times p.i. as indicated for an MOI of 3 (B) or an MOI of 10 (C). A histogram represents the average values from three independent experiments by counting 400 cells per experiment. The results are expressed as the percentages of uninfected cells or cells containing one, two, three, four, and more IBs and are depicted by six variously shaded columns from left to right, respectively, for each time point. Error bars indicate the standard deviation.
FIG. 7.
FIG. 7.
Formation of IBs does not require dynein-mediated transport. (A) BSR cells were transfected with a plasmid encoding the P-RFP or a P-RFP mutant that does not interact with LC8 (PΔLC8-RFP) and then infected for 24 h. Cells were stained with the MAb 62B5 anti-N antibody (N), followed by incubation with Alexa 488-goat anti-mouse IgG and DAPI (merge). The scale bars correspond to 12 μm. (B) BSR cells were transfected with a plasmid encoding dynamitin-GFP and then infected for 24 h. Cells were stained with a rabbit polyclonal anti-P antibody (P), followed by incubation with Alexa 568-goat anti-rabbit IgG and DAPI (merge). Colocalization is apparent as yellow coloration in the merged panel. The scale bars correspond to 12 μm.
FIG. 8.
FIG. 8.
Viral RNAs accumulate in viral IBs. BSR cells were infected (MOI = 3) for 16 h p.i. (A and B) FISH analyses were performed with biotinylated oligonucleotides (described in Materials and Methods), followed by incubation with streptavidin conjugated to Cy3 to detect NmRNA, PmRNA, MmRNA, GmRNA, and LmRNA as indicated (A) and to detect viral genomic and antigenomic RNA as indicated (B). Note that the probe used to detect the mRNA also allows the detection of the antigenome. In contrast, the probe used to detect the antigenome was designed in order to avoid the detection of the mRNA. Note that for the antigenomes, the photomultiplier tube (PMT) has been increased in order to clearly visualize the fluorescence signals resulting in an increase of the background signal. No positive signal was observed in mock-infected cells (indicated by an arrow). (C) FISH was also performed to detect the housekeeping GADPH mRNA or cellular mRNA (Poly-A) after treatment with RNase (+RNase) or without RNase (-RNase). No signal was observed with a control probe complementary to the MmRNA of VSV. In all cases, the N protein (N) was stained with the mouse MAb anti-N (62B5) antibody, followed by incubation with Alexa 488-goat anti-mouse IgG (A, B, and C). The scale bars correspond to 12 μm. (D) Relative quantification of the viral RNA accumulated inside the Negri bodies. FISH was performed as described above. Quantification of Cy3 fluorescent intensity (arbitrary units [ua]) was performed with the same PMT (the PMT adjusted with the N mRNA probe) on a Leica SP2 confocal microscope. The surface area and the Cy3 fluorescence intensity of each Negri body was calculated by using Leica confocal software. Two independent experiments were performed by counting an average of 300 IBs. The results were expressed as the log10 of Cy3's intensity per μm2 of Negri body and per probe (ua/μm2).
FIG. 9.
FIG. 9.
Newly synthesized viral RNAs are present inside the viral IBs. (A) BSR cells were infected at an MOI of 3 for 16 h p.i., transfected with BrUTP for 20 min in the presence (+ActD) or absence (-ActD) of ActD. P protein (as a marker of the Negri bodies) was detected by using the rabbit polyclonal anti-P antibody, followed by incubation with Alexa 568-goat anti-rabbit IgG (P). Newly synthesized RNAs were detected by using mouse MAb anti-BrdU antibody (BrUTP) and goat anti-mouse Alexa 488. Colocalization of the viral RNA (vRNA) with the IBs is shown in the merged panel in the presence of the drug (+ActD). In cells untreated with ActD, cellular mRNA is produced in vast excess over vRNA. Thus, for these images, the PMT gain of the confocal laser scanning microscope is lower, so the signal for vRNA is lower than for that shown in the presence of the drug, and specific colocalization is not readily observed. The scale bars correspond to 12 μm. (B) BrUTP signals are specific to RNA produced by rabies virus. BSR cells were infected with the VTF7-3 recombinant virus and cotransfected with plasmids expressing N and P proteins. Cells were then transfected with BrUTP for 20 min in the presence (+ActD) or absence (-ActD) of ActD. P protein and RNA were detected as in panel A. Note that in the absence of the drug, no BrUTP signal is detectable in the IBs formed by N and P proteins, but some RNA signals are detected in the cytoplasmic inclusions, most probably due to vaccinia virus infection (-ActD). In the presence of the drug, no RNA labeling is observed (+ActD).

References

    1. Ball, L. A., and C. N. White. 1976. Order of transcription of genes of vesicular stomatitis virus. Proc. Natl. Acad. Sci. USA 73442-446. - PMC - PubMed
    1. Chen, M., and D. Gerlier. 2006. Viral hijacking of cellular ubiquitination pathways as an anti-innate immunity strategy. Viral Immunol. 19349-362. - PubMed
    1. Chenik, M., K. Chebli, Y. Gaudin, and D. Blondel. 1994. In vivo interaction of rabies virus phosphoprotein (P) and nucleoprotein (N): existence of two N-binding sites on P protein. J. Gen. Virol. 75(Pt. 11)2889-2896. - PubMed
    1. Das, S. C., D. Nayak, Y. Zhou, and A. K. Pattnaik. 2006. Visualization of intracellular transport of vesicular stomatitis virus nucleocapsids in living cells. J. Virol. 806368-6377. - PMC - PubMed
    1. Dohner, K., A. Wolfstein, U. Prank, C. Echeverri, D. Dujardin, R. Vallee, and B. Sodeik. 2002. Function of dynein and dynactin in herpes simplex virus capsid transport. Mol. Biol. Cell 132795-2809. - PMC - PubMed

Publication types