. 2009 Aug;83(16):7805-14.
doi: 10.1128/JVI.00280-09. Epub 2009 Jun 3.

Analysis of the percentage of human immunodeficiency virus type 1 sequences that are hypermutated and markers of disease progression in a longitudinal cohort, including one individual with a partially defective Vif

Affiliations

Analysis of the percentage of human immunodeficiency virus type 1 sequences that are hypermutated and markers of disease progression in a longitudinal cohort, including one individual with a partially defective Vif

Anne Piantadosi et al. J Virol. 2009 Aug.

Abstract

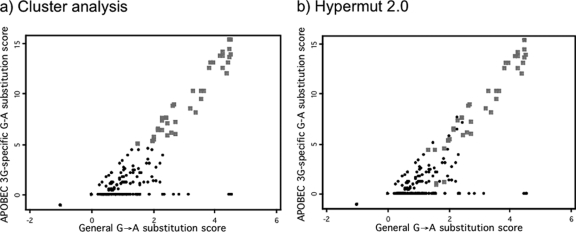
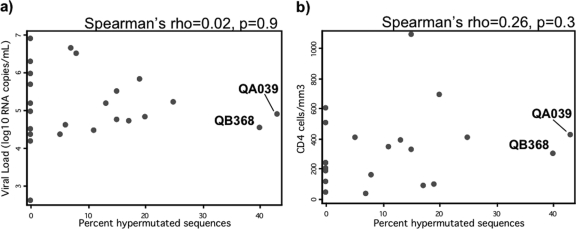
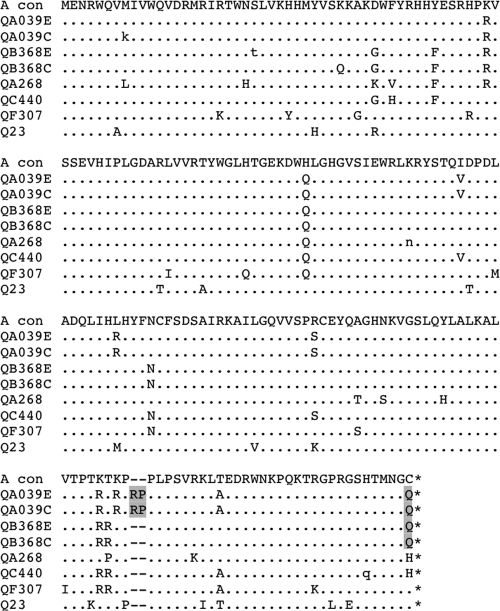
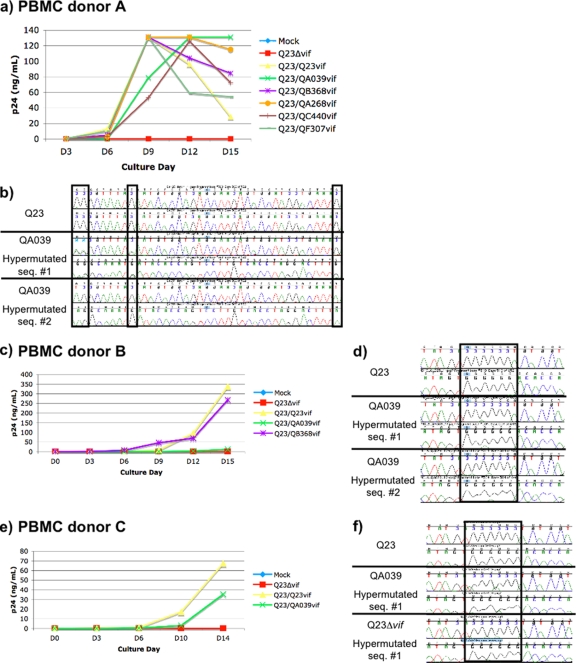
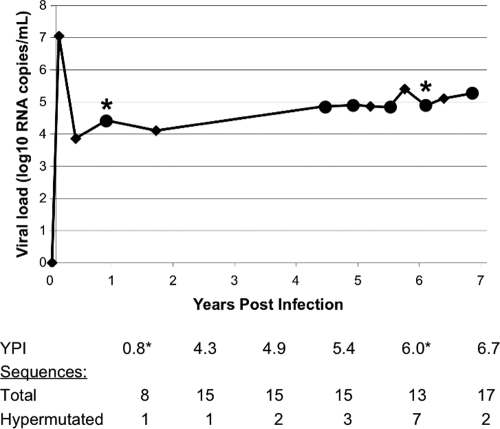
Hypermutation, the introduction of excessive G-to-A substitutions by host proteins in the APOBEC family, can impair replication of the human immunodeficiency virus (HIV). Because hypermutation represents a potential antiviral strategy, it is important to determine whether greater hypermutation is associated with slower disease progression in natural infection. We examined the level of HIV-1 hypermutation among 28 antiretroviral-naive Kenyan women at two times during infection. By examining single-copy gag sequences from proviral DNA, hypermutation was detected in 16 of 28 individuals. Among individuals with any hypermutation, a median of 15% of gag sequences were hypermutated (range, 5 to 43%). However, there was no association between the level of gag hypermutation and the viral load or CD4 count. Thus, we observed no overall relationship between hypermutation and markers of disease progression among individuals with low to moderate levels of hypermutation. In addition, one individual sustained a typical viral load despite having a high level of hypermutation. This individual had 43% of gag sequences hypermutated and harbored a partially defective Vif, which was found to permit hypermutation in a peripheral blood mononuclear cell culture. Overall, our results suggest that a potential antiviral therapy based on hypermutation may need to achieve a substantially higher level of hypermutation than is naturally seen in most individuals to impair virus replication and subsequent disease progression.


Figures

FIG. 1.
FIG. 1.
Definition of hypermutation by two methods. In each plot, the APOBEC3G-specific score for each sequence is plotted against its general G→A score (see Materials and Methods). In panel a, sequences identified as hypermutated by k-means cluster analysis are indicated as gray squares, while those not hypermutated are black circles. In panel b, sequences identified as hypermutated by Hypermut 2.0 are indicated as gray squares, while those not hypermutated are black circles.
FIG. 2.
FIG. 2.
Associations between the level of gag proviral hypermutation and markers of disease progression. Each point represents one individual, with the percentage of gag sequences that were identified as hypermutated indicated on the x axis. Plasma viral load (a) and CD4 count (b) measured in chronic infection are indicated on the y axis. Associations were evaluated by using the Spearman rank correlation test, with results indicated above the plots. The two individuals with extensive hypermutation (at least 40%) are labeled.
FIG. 3.
FIG. 3.
Alignment of Vif sequences. This alignment includes sequences from the two individuals with extensive hypermutation (QA039 and QB368) at both early (E) and chronic (C) infection time points, three other randomly chosen individuals in the present study (QA268, QC340, and QF307), and a subtype A reference strain from Kenya (Q23). All sequences are subtype A based on phylogenetic analysis (not shown) and are aligned against the subtype A consensus sequence (A con). Amino acid substitutions are indicated with capital letters, and positions with a mixture of amino acids are indicated with lowercase letters. The two polymorphisms of interest are highlighted in gray. *, Stop codon.
FIG. 4.
FIG. 4.
Virus replication and hypermutation in PBMC cultures of vif variants. (a) Plot of p24 pg/ml versus day of culture for each vif variant in the first set of cultures (PBMC from donor A, infected at an MOI of 0.02). Q23Δvif (red line) is the negative control; Q23/Q23vif (yellow) is the vif defective clone with its own vif reinserted; Q23/QA039vif (green) and Q23/QB368vif (purple) contain vif variants from individuals with extensive hypermutation; and Q23/QA268vif, Q23/QC440vif, and Q23/QF307vif are vif variants from other individuals without extensive hypermutation. (b) Example of a gag sequence from the Q23 culture (top) and two gag sequences from the QA039 culture (middle and bottom) for donor A. For each sequence, a region of both the forward and reverse sequencing chromatograms is shown. The positions in which G-to-A changes or mixed G-A peaks were identified are indicated in boxes. For QA039 hypermutated sequence 1, three positions with mixed peaks are indicated in the first two boxes. For QA039 hypermutated sequence 2, two G-to-A substitutions are indicated in the first and third boxes. Cultures were repeated for a subset of the vif variants in PBMC from two different donors infected at an MOI of 0.1, and plots of p24 versus day of culture are shown for donor B (c) and donor C (e). (d) Two hypermutated sequences from the QA039 culture for donor B are shown, with mixed peaks highlighted in the box. (f) One sequence each from the Q23, QA039, and Q23Δvif cultures for donor C. The box highlights a region in which two mixed peaks were found in QA039 and three in Q23Δvif.
FIG. 5.
FIG. 5.
Evaluation of hypermutation throughout infection in QA039. The plot indicates this individual's viral load through time. Diamonds represent follow-up visits, and those at which sequences were examined are marked with large circles. The early infection and chronic infection time points used in the initial screen for hypermutation are marked by asterisks. The table below the graph shows the total number of gag proviral sequences that were examined at each time point, as well as the number of sequences that were found to be hypermutated.

Similar articles

Cited by

References

    1. Benki, S., R. S. McClelland, S. Emery, J. M. Baeten, B. A. Richardson, L. Lavreys, K. Mandaliya, and J. Overbaugh. 2006. Quantification of genital human immunodeficiency virus type 1 (HIV-1) DNA in specimens from women with low plasma HIV-1 RNA levels typical of HIV-1 nontransmitters. J. Clin. Microbiol. 444357-4362. - PMC - PubMed
    1. Bishop, K. N., R. K. Holmes, and M. H. Malim. 2006. Antiviral potency of APOBEC proteins does not correlate with cytidine deamination. J. Virol. 808450-8458. - PMC - PubMed
    1. Bishop, K. N., M. Verma, E. Y. Kim, S. M. Wolinsky, and M. H. Malim. 2008. APOBEC3G inhibits elongation of HIV-1 reverse transcripts. PLoS Pathog. 4e1000231. - PMC - PubMed
    1. Blish, C. A., M. A. Nguyen, and J. Overbaugh. 2008. Enhancing exposure of HIV-1 neutralization epitopes through mutations in gp41. PLoS Med. 5e9. - PMC - PubMed
    1. Chelico, L., P. Pham, P. Calabrese, and M. F. Goodman. 2006. APOBEC3G DNA deaminase acts processively 3′→5′ on single-stranded DNA. Nat. Struct. Mol. Biol. 13392-399. - PubMed

Publication types

MeSH terms

Substances