. 2009 Sep 1;18(17):3244-56.
doi: 10.1093/hmg/ddp262. Epub 2009 Jun 3.

Golgi function and dysfunction in the first COG4-deficient CDG type II patient

Affiliations

Golgi function and dysfunction in the first COG4-deficient CDG type II patient

Ellen Reynders et al. Hum Mol Genet. .

Abstract

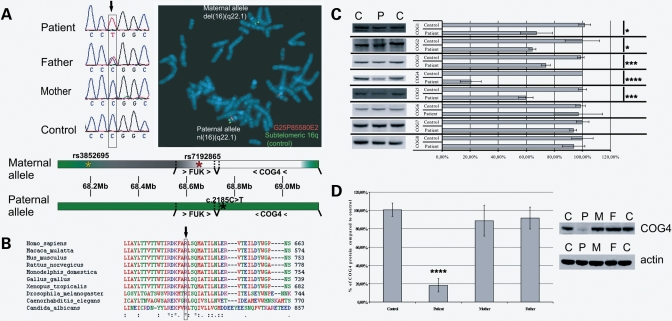
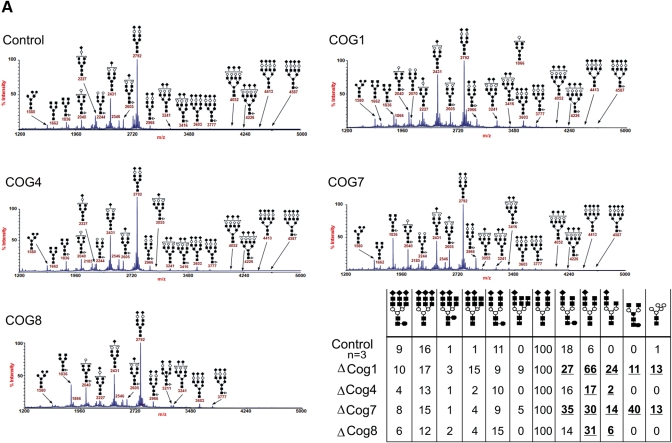
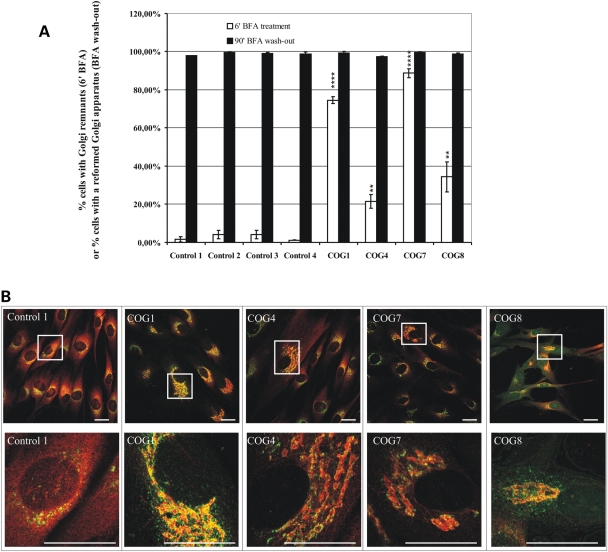
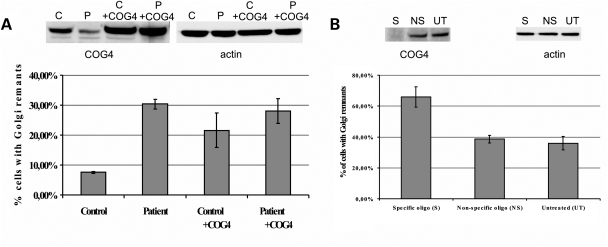
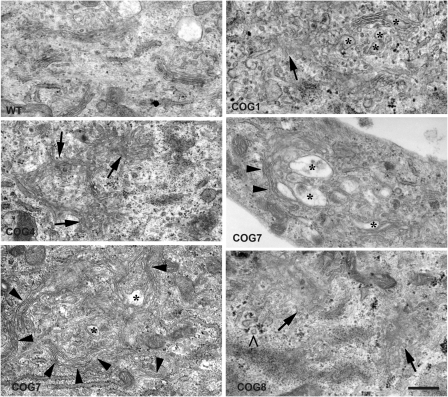
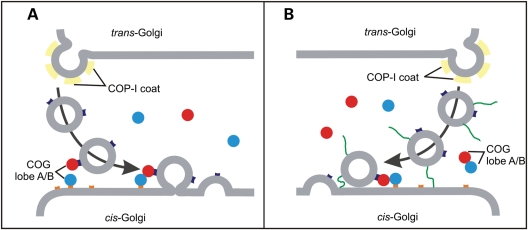
The conserved oligomeric Golgi (COG) complex is a hetero-octameric complex essential for normal glycosylation and intra-Golgi transport. An increasing number of congenital disorder of glycosylation type II (CDG-II) mutations are found in COG subunits indicating its importance in glycosylation. We report a new CDG-II patient harbouring a p.R729W missense mutation in COG4 combined with a submicroscopical deletion. The resulting downregulation of COG4 expression additionally affects expression or stability of other lobe A subunits. Despite this, full complex formation was maintained albeit to a lower extent as shown by glycerol gradient centrifugation. Moreover, our data indicate that subunits are present in a cytosolic pool and full complex formation assists tethering preceding membrane fusion. By extending this study to four other known COG-deficient patients, we now present the first comparative analysis on defects in transport, glycosylation and Golgi ultrastructure in these patients. The observed structural and biochemical abnormalities correlate with the severity of the mutation, with the COG4 mutant being the mildest. All together our results indicate that intact COG complexes are required to maintain Golgi dynamics and its associated functions. According to the current CDG nomenclature, this newly identified deficiency is designated CDG-IIj.


Figures

Figure 1.
Figure 1.
Genetic and molecular characterization of the described COG4 patient. (A) Sequencing revealed a heterozygous C>T missense mutation in the patient and the absence of this mutation in the mother. The fluorescence in situ hybridization (FISH) image shows the deletion of fosmid G24P85580E2 (red) on the maternal allele, whereas the control subtelomeric 16q fosmid (green) shows a normal signal. A schematic representation of the mutations present in the patient is given, the green and red asterisk on the maternal allele indicate, respectively, the last heterozygous SNP and the first hemizygous SNP in the patient, the black asterisk on the paternal allele indicates the position of the missense mutation, green regions indicate genes (> …>: sense/< …<: antisense/bars indicate the location of each gene) and intergenic regions that are present in the patient, the white and grey regions on the maternal allele indicate, respectively, the known deleted region and the region containing the proximal breakpoint. (B) Alignment of the COG4 sequence of different species shows an absolute conservation of this residue. (C) Lysates of a control, the COG4 patient and both parents were loaded on SDS–PAGE gel to analyze the COG4 levels. Quantifications represent the mean values of three independent loadings of independent samples. Error bars represent the SEM, a Student t-test resulted in a highly significant P-value (≤0.001—indicated as ****) when comparing control and patient. (D) Western blot of control and patient for all COG subunits. Quantifications represent the mean values of three independent loadings of independent samples. Error bars represent the SEM, a Student t-test was used to obtain the P-values indicated in the graph as */***/****, representing, respectively, P ≤ 0.1/P ≤ 0.01/P ≤ 0.001.
Figure 2.
Figure 2.
The COG4 mutation does not abrogate normal assembly of the full complex. (A) Glycerol gradient centrifugation was performed on cytosolic and membrane fractions of a control (C) and the COG4 patient (P4), all 12 fractions obtained were loaded onto SDS–PAGE gels and the distribution of COG3, -4, -7 and -8 was analyzed using western blot, asterisks indicate the migration of the 669 kDa marker thyroglobulin. Exposure times differ between cytosolic and membrane fractions, due to the mainly cytosolic localization of the complex. (B) Cytosol and membrane fractions were obtained from the cells of a control and the COG4 patient. Quantifications after western blot shows that there is no difference between the COG4 distribution in control and patient's cells. (C) Glycerol gradient centrifugation was performed on membrane fractions of a control (C) and the COG8 patient (P8), all 12 fractions obtained were loaded onto SDS–PAGE gels and the distribution of the COG1, -3 and -8 proteins was analyzed using western blot, asterisks indicate the migration of the 669 kDa marker thyroglobulin. Exposure times differ between cytosolic and membrane fractions, due to the mainly cytosolic localization of the complex.
Figure 3.
Figure 3.
Presence of abnormal N-glycosylated proteins in the serum of the COG-deficient patients. (A) Mass spectrometry results of serum samples of all known patients and a control, show a deficiency in the N-glycosylation pathway in the Golgi apparatus in all patients. (B) Quantification of the results shown in (A), the control values are the mean of the results obtained from serum samples of three independent controls. All patients have a clear decrease in sialylation of their N-glycan chains (m/z 2431 and 2605), furthermore the COG1 and -7 patients also show a remarkable galactosylation (m/z 2040) and demannosylation (m/z 1580) deficiency.
Figure 4.
Figure 4.
Cells of all known COG patients show trafficking defects. (A) Cells of all patients and four controls were treated with Brefeldin A for 6 or 60 min followed by wash-out of the drug. Cells were stained for GM130 and ManII, 300 cells were counted per cell line and based on the ManII staining each counted cell was scored for the presence or absence of Golgi (remnants), the results are averages of three independent experiments per cell line, the error bars represent the SEM, a Student t-test was used to obtain the P-values indicated in the graph as **/****, representing, respectively, P ≤ 0.05/P ≤ 0.001. (B) Representative confocal laser scanning microscopy (CLSM) images of control and patient cells obtained after staining for GM130 (green) and ManII (red). Both 60× and representative zoomed pictures are shown, scale bars represent 10 µm.
Figure 5.
Figure 5.
Effects of COG4 overexpression and downregulation on the retrograde trafficking defect. (A) Patient and control cells were transduced with COG4-containing viral particles, the resulting overexpression was analyzed on western blot and compared with COG4 levels present in untreated control and patient cells. After BFA treatment of all four cell lines the percentage of abnormal cells was counted, based on ManII staining, results are averages of three independent BFA treatments, error bars represent the SEM. (B) HeLa cells were transfected three times independently with a ‘smart pool’ of RNAi oligo's specific for the COG4 sequence (S). The extent of downregulation was assessed using western blot and compared with untreated cells (UT) and cells treated with a non-specific oligo (NS). The percentage of abnormal cells, counted after BFA treatment and ManII staining, is represented in the graph as an average of three different experiments. Error bars represent the SEM, a Student t-test was performed resulting in a significant P-value of 0.022, when compared with the untreated cells.
Figure 6.
Figure 6.
Analysis of the Golgi morphology at the submicroscopical level. Cells of all patients and one control were subjected to electron microscopy. Both the COG1- and COG4-deficient patient cells still show some stacks with a normal morphology, in contrast to the COG7 and COG8 patients. The most striking finding mainly in the COG7 and COG8 patients was the undulated appearance of the stacked cisternae, as indicated by the arrowheads. Furthermore, several stacks have a fragmented and/or vesiculated appearance, indicated by arrows, a phenotype which is most severe in the COG8 patient. The asterisks indicate swollen cisternae which were present in a differing degree in all patients. The ‘>‘points to clathrin-coated vesicles, indicating the trans-side of the Golgi apparatus.
Figure 7.
Figure 7.
Hypothetical models on (the regulation of) the action of the COG complex. Retrograde transport organelles as well as target antecedent cisternal membranes are proposed to recruit single lobe A or B subcomplexes (red and blue circles) from cytosolic pools. Tethering of the vesicle to the cisternal membrane occurs by binding of both lobes and full complex formation (A) or by directly binding of the full complex to either of the membranes (B). Recruitment of the COG complex to the membrane may include, as yet unknown, proteins (orange and purple boxes). Also, model B suggests the presence of a long-distance tether (green line) that initially captures the vesicle prior to COG complex recruitment. After tethering, the soluble NSF attachment protein receptor (SNARE) fusion machinery drives the fusion of vesicle and membrane followed by dissociation of the COG complex from the membrane and from each other.

Similar articles

Cited by

References

    1. Lippincott-Schwartz J., Zaal K.J. Cell cycle maintenance and biogenesis of the Golgi complex. Histochem. Cell Biol. 2000;114:93–103. - PubMed
    1. Yan A., Lennarz W.J. Unraveling the mechanism of protein N-glycosylation. J. Biol. Chem. 280:3121–3124. - PubMed
    1. Holthuis J.C., Pomorski T., Raggers R.J., Sprong H., Van Meer G. The organizing potential of sphingolipids in intracellular membrane transport. Physiol. Rev. 2001;81:1689–1723. - PubMed
    1. Dunphy W.G., Rothman J.E. Compartmental organization of the Golgi stack. Cell. 1985;42:13–21. - PubMed
    1. Rothman J.E., Miller R.L., Urbani L.J. Intercompartmental transport in the Golgi complex is a dissociative process: facile transfer of membrane protein between two Golgi populations. J. Cell Biol. 1984;99:260–271. - PMC - PubMed

Publication types

MeSH terms