. 2009 Aug;20(15):3503-13.
doi: 10.1091/mbc.e09-02-0111. Epub 2009 Jun 3.

Chromatin-dependent transcription factor accessibility rather than nucleosome remodeling predominates during global transcriptional restructuring in Saccharomyces cerevisiae

Affiliations

Chromatin-dependent transcription factor accessibility rather than nucleosome remodeling predominates during global transcriptional restructuring in Saccharomyces cerevisiae

Karl A Zawadzki et al. Mol Biol Cell. 2009 Aug.

Abstract

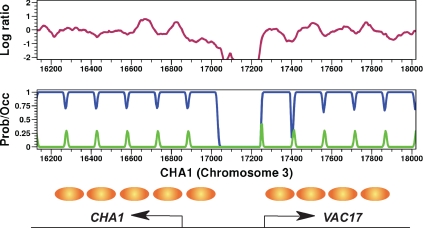
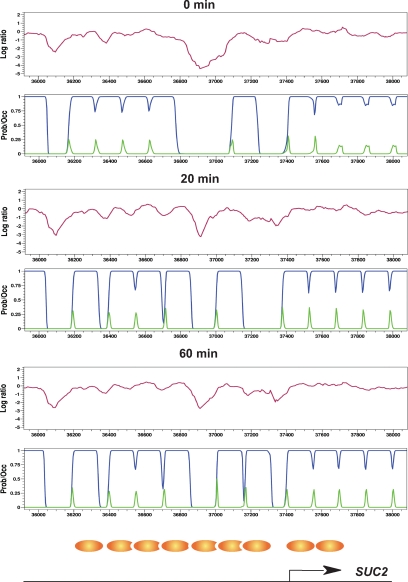
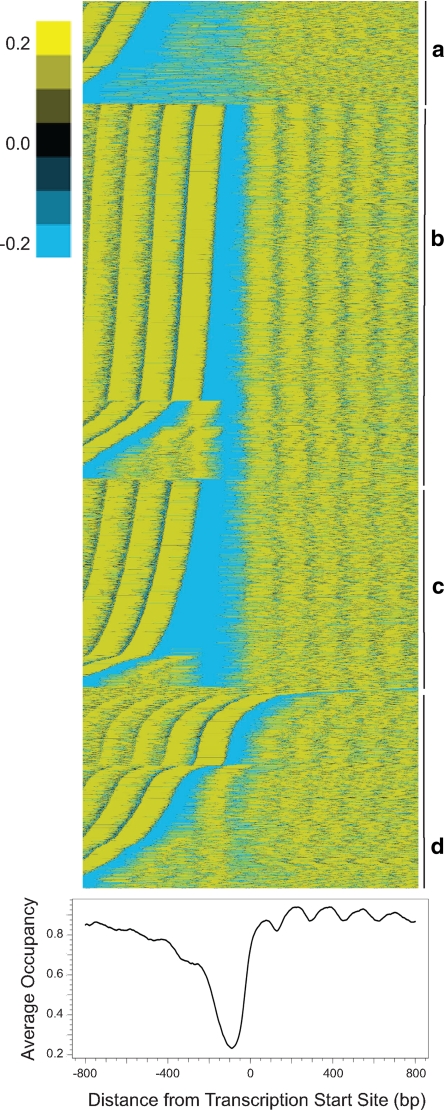
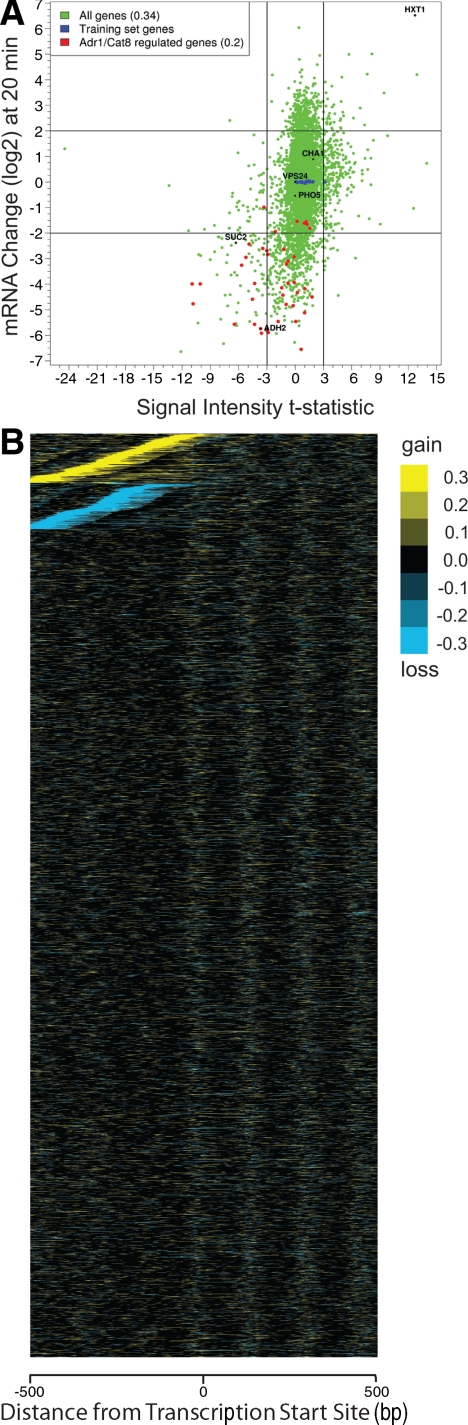
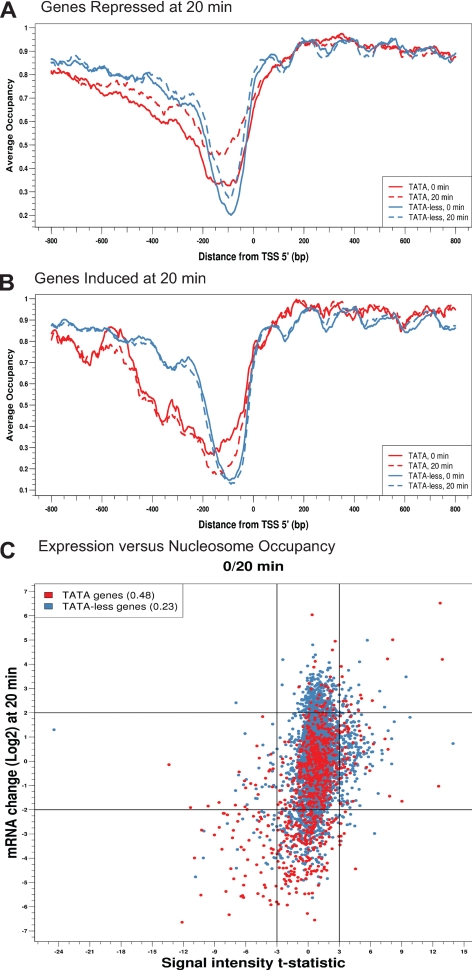
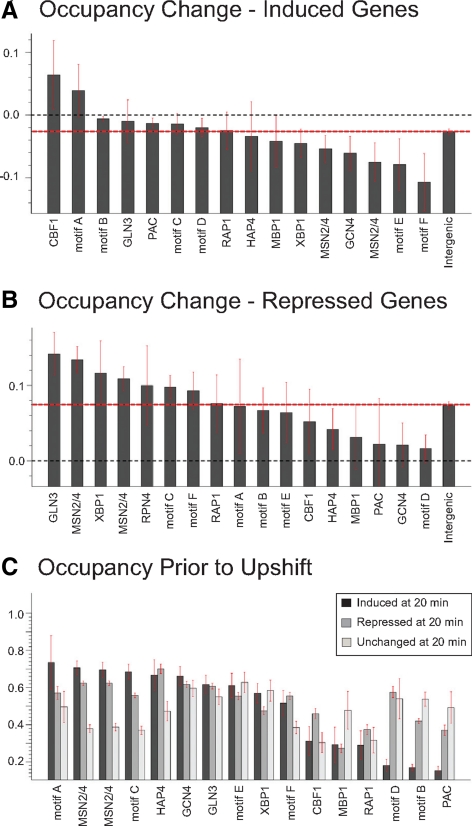
Several well-studied promoters in yeast lose nucleosomes upon transcriptional activation and gain them upon repression, an observation that has prompted the model that transcriptional activation and repression requires nucleosome remodeling of regulated promoters. We have examined global nucleosome positioning before and after glucose-induced transcriptional reprogramming, a condition under which more than half of all yeast genes significantly change expression. The majority of induced and repressed genes exhibit no change in promoter nucleosome arrangement, although promoters that do undergo nucleosome remodeling tend to contain a TATA box. Rather, we found multiple examples where the pre-existing accessibility of putative transcription factor binding sites before glucose addition determined whether the corresponding gene would change expression in response to glucose addition. These results suggest that selection of appropriate transcription factor binding sites may be dictated to a large extent by nucleosome prepositioning but that regulation of expression through these sites is dictated not by nucleosome repositioning but by changes in transcription factor activity.


Figures

Figure 1.
Figure 1.
Nucleosome positioning at the CHA1 promoter. Top, log ratio of nucleosomal DNA to genomic DNA as determined by separate hybridizations to Affymetrix tiling arrays is plotted as a function of genomic position. Increasing values represent increasing MNase protection. Middle, nucleosome positions as predicted by the HMM used in this study. Blue track represents predicted nucleosome occupancy, from unoccupied (0) to fully occupied (1). Green track represents the probability of initiating a nucleosome at that location. Bottom, previously determined in vivo nucleosome positions (Moreira and Holmberg, 1998) are shown as brown ovals.
Figure 2.
Figure 2.
Glucose-induced nucleosome remodelling at the SUC2 promoter. Nucleosome protection data, represented as the log ratio of nucleosomal DNA to genomic DNA by tiling microarray (purple line), HMM prediction of the probability of nucleosome occupancy (blue line) and HMM prediction of the probability of initiating a nucleosome (green line) are shown for the SUC2 promoter, diagrammed at the bottom, at the indicated times before (0 min) or after (20 and 60 min) glucose addition. Previously determined in vivo nucleosome positions for the SUC2 promoter in cells grown in glucose (Gavin and Simpson, 1997) are shown as brown ovals.
Figure 3.
Figure 3.
Genome-wide promoter nucleosome structures. Top, nucleosome structure at individual promoters. Nucleosome occupancy for individual promoters aligned relative to the transcriptional start site (Nagalakshmi et al., 2008) was clustered by K-means into four groups (a–d) and then sorted sequentially within each group by the position of the minimum occupancy value. The mean nucleosome occupancy was subtracted from all values. Bottom, genome-wide average promoter nucleosome profile. The nucleosome occupancies for all promoters were aligned relative to the transcription start site, which is set as position 0, and then averaged at every nucleotide 800 base pairs upstream and 800 base pairs downstream over all genes to yield the average occupancy, which ranges from 0 (no nucleosome) to 1 (fully occupied).
Figure 4.
Figure 4.
Nucleosome remodelling occurs infrequently during transcriptional reprogramming. (A) Scatter plot showing the relationship between transcriptional change and nucleosome remodelling. Each point represents a single gene providing, on the x-axis, the t-statistic measure of the change in promoter nucleosome density 20 min after glucose addition relative to that before addition, plotted against the log2 change in mRNA levels 20 min after glucose addition. Promoters are defined as the region 800 base pairs upstream of the ORF, or until the next ORF. Correlation values (r) between transcriptional change and the nucleosome occupancy change are provided in the legend. (B) Representation of the differences in nucleosome occupancy at each nucleotide in individual promoters (vertical axis) 20 min after glucose addition relative to that before addition were calculated and plotted relative to the transcription start sites (horizontal axis, extending from −500 base pairs to +500 base pairs). These are clustered by K-means into three groups and then sorted within each group sequentially by maximum difference value (top cluster) or minimum difference value (middle cluster). The genes in the bottom cluster were not sorted.
Figure 5.
Figure 5.
Promoters with TATA boxes are more likely to undergo nucleosome remodelling. (A) All genes repressed fourfold or more 20 min after glucose addition were subdivided into those containing TATA box in their promoters (blue lines) and those lacking TATA boxes (red lines) (Basehoar et al., 2004). For each subgroup, the average nucleosome occupancy at every nucleotide around the TSS was calculated before glucose addition (solid line) and 20 min after glucose addition (dashed line) and the values plotted relative to the position of the nucleotide from the TSS. (B) As in A, but for genes induced fourfold or more 20 min after glucose addition. (C) As in Figure 4A, but with all genes subdivided by the presence or absence of a TATA box within the promoter. Correlation values (r) are shown in the legend.
Figure 6.
Figure 6.
Nucleosomes are instructive for transcription factor regulation. For all genes induced (A) or repressed (B) fourfold or more 20 min after glucose addition, all occurrences of the listed motifs in promoters of those genes were noted and the average change in nucleosome occupancy directly over that motif determined. Values range from −1, which denotes a motif fully occupied at 0 min that becomes fully unoccupied 20 min after glucose addition, to 1, which denotes a motif fully unoccupied at 0 min that becomes fully occupied at 20 min. The bar labeled “intergenic” is the average change in nucleosome occupancy over all (A) glucose-induced or (B) repressed promoters. Error bars designate SE. (C) All instances of the listed motifs present in gene promoters were subdivided into those in genes whose expression was repressed following glucose addition, unchanged after glucose addition or induced after glucose addition. For each subset for each motif, the average nucleosome occupancy directly over that motif prior to glucose addition is plotted, with values ranging from completely unoccupied (0) to fully occupied (1). Error bars designate SE. Transcription factor motifs are as follows: Cbf1, [CGT]CA[CG]GTG[AG][AC]; Gln3, [ACT]GATAAG[ACG]; PAC, CTCATC[GT]C; Rap1, A[CT]CC.ACA[CT]; Hap4, [ACG]CCA[AC]TCA; Mbp1, T.[AT]CGCGT[ACT]; Xbp1, [CT][CT]TCG[AC]G[AG][CGT]; Msn2/4, [ACG][AG][ACT]. GGGG or CCCCT[AGT]; Gcn4, TGACT[ACT]A. Motif definitions are as follows: A, CGC[AG]C[CT]C[AT]; B, the RRPE motif [ACG]AAANTTTT; C, [AGT][AT][AT]AAGGG; D, GATCN3TGA[AG]; E, [CGT]TA[AT]ACGA.; F, [CGT]CCGN5CC[ACG].

Similar articles

Cited by

References

    1. Agricola E., Verdone L., Xella B., Di Mauro E., Caserta M. Common chromatin architecture, common chromatin remodeling, and common transcription kinetics of Adr1-dependent genes in Saccharomyces cerevisiae. Biochemistry. 2004;43:8878–8884. - PubMed
    1. Albert I., Mavrich T. N., Tomsho L. P., Qi J., Zanton S. J., Schuster S. C., Pugh B. F. Translational and rotational settings of H2A.Z nucleosomes across the Saccharomyces cerevisiae genome. Nature. 2007;446:572–576. - PubMed
    1. Almer A., Rudolph H., Hinnen A., Horz W. Removal of positioned nucleosomes from the yeast PHO5 promoter upon PHO5 induction releases additional upstream activating DNA elements. EMBO J. 1986;5:2689–2696. - PMC - PubMed
    1. Basehoar A. D., Zanton S. J., Pugh B. F. Identification and distinct regulation of yeast TATA box-containing genes. Cell. 2004;116:699–709. - PubMed
    1. Beer M. A., Tavazoie S. Predicting gene expression from sequence. Cell. 2004;117:185–198. - PubMed

Publication types

MeSH terms

LinkOut - more resources