

Red fluorescent protein pH biosensor to detect concentrative nucleoside transport
- PMID: 19494110
- PMCID: PMC2742814
- DOI: 10.1074/jbc.M109.019042
Red fluorescent protein pH biosensor to detect concentrative nucleoside transport
Abstract
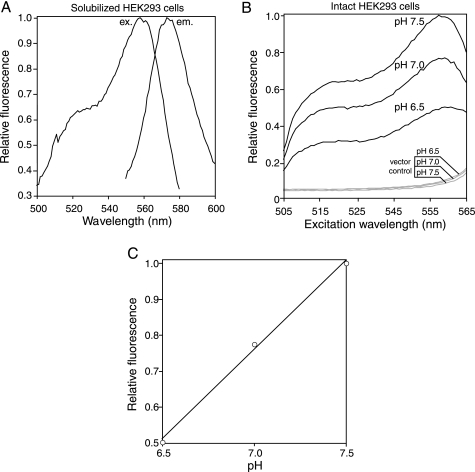
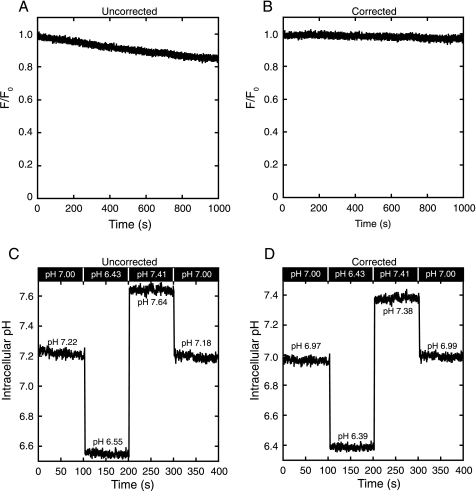
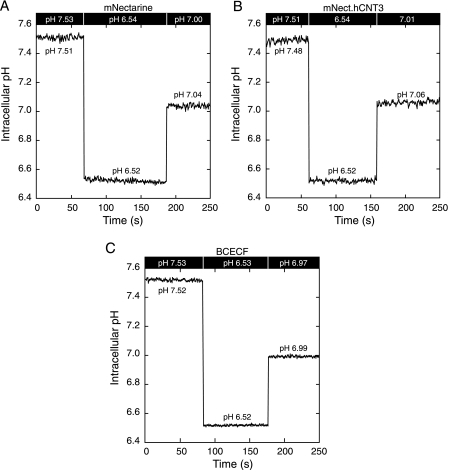
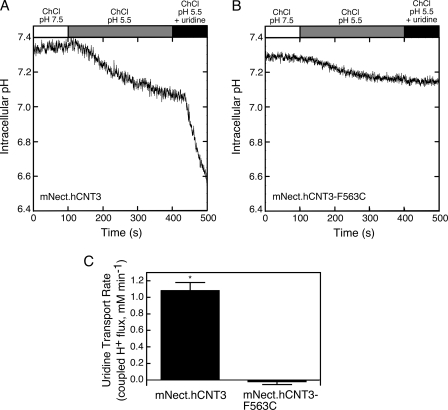
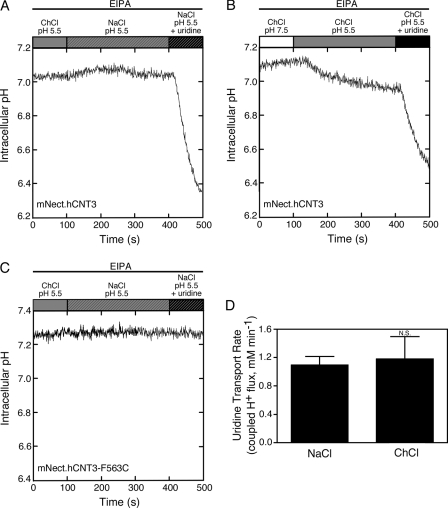
Human concentrative nucleoside transporter, hCNT3, mediates Na+/nucleoside and H+/nucleoside co-transport. We describe a new approach to monitor H+/uridine co-transport in cultured mammalian cells, using a pH-sensitive monomeric red fluorescent protein variant, mNectarine, whose development and characterization are also reported here. A chimeric protein, mNectarine fused to the N terminus of hCNT3 (mNect.hCNT3), enabled measurement of pH at the intracellular surface of hCNT3. mNectarine fluorescence was monitored in HEK293 cells expressing mNect.hCNT3 or mNect.hCNT3-F563C, an inactive hCNT3 mutant. Free cytosolic mNect, mNect.hCNT3, and the traditional pH-sensitive dye, BCECF, reported cytosolic pH similarly in pH-clamped HEK293 cells. Cells were incubated at the permissive pH for H(+)-coupled nucleoside transport, pH 5.5, under both Na(+)-free and Na(+)-containing conditions. In mNect.hCNT3-expressing cells (but not under negative control conditions) the rate of acidification increased in media containing 0.5 mm uridine, providing the first direct evidence for H(+)-coupled uridine transport. At pH 5.5, there was no significant difference in uridine transport rates (coupled H+ flux) in the presence or absence of Na+ (1.09 +/- 0.11 or 1.18 +/- 0.32 mm min(-1), respectively). This suggests that in acidic Na(+)-containing conditions, 1 Na+ and 1 H+ are transported per uridine molecule, while in acidic Na(+)-free conditions, 1 H+ alone is transported/uridine. In acid environments, including renal proximal tubule, H+/nucleoside co-transport may drive nucleoside accumulation by hCNT3. Fusion of mNect to hCNT3 provided a simple, self-referencing, and effective way to monitor nucleoside transport, suggesting an approach that may have applications in assays of transport activity of other H(+)-coupled transport proteins.
Figures
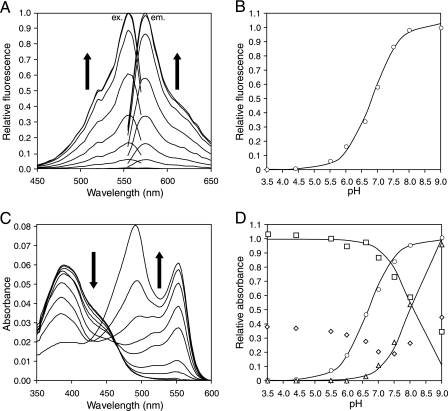
 , orange-absorbing) and three Gaussian curves centered at 489 nm (⬡, cyan-absorbing), 453 nm (♢, blue-absorbing), and 387 nm (□, violet-absorbing).
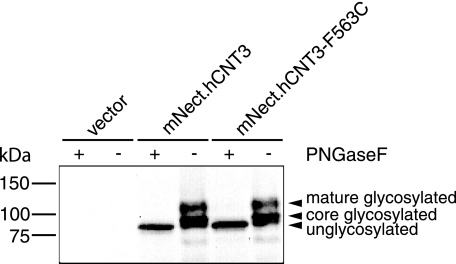
Similar articles
-
Cytosolic H+ microdomain developed around AE1 during AE1-mediated Cl-/HCO3- exchange.J Physiol. 2011 Apr 1;589(Pt 7):1551-69. doi: 10.1113/jphysiol.2010.201483. Epub 2011 Feb 7. J Physiol. 2011. PMID: 21300752 Free PMC article.
-
The broadly selective human Na+/nucleoside cotransporter (hCNT3) exhibits novel cation-coupled nucleoside transport characteristics.J Biol Chem. 2005 Jul 8;280(27):25436-49. doi: 10.1074/jbc.M409454200. Epub 2005 May 3. J Biol Chem. 2005. PMID: 15870078
-
Effects of Na+ and H+ on steady-state and presteady-state currents of the human concentrative nucleoside transporter 3 (hCNT3).Pflugers Arch. 2010 Aug;460(3):617-32. doi: 10.1007/s00424-010-0846-9. Epub 2010 May 22. Pflugers Arch. 2010. PMID: 20495821
-
Recent molecular advances in studies of the concentrative Na+-dependent nucleoside transporter (CNT) family: identification and characterization of novel human and mouse proteins (hCNT3 and mCNT3) broadly selective for purine and pyrimidine nucleosides (system cib).Mol Membr Biol. 2001 Jan-Mar;18(1):65-72. doi: 10.1080/09687680010026313. Mol Membr Biol. 2001. PMID: 11396613 Review.
-
Renal nucleoside transporters: physiological and clinical implications.Biochem Cell Biol. 2006 Dec;84(6):844-58. doi: 10.1139/o06-198. Biochem Cell Biol. 2006. PMID: 17215872 Review.
Cited by
-
Survey of Red Fluorescence Proteins as Markers for Secretory Granule Exocytosis.PLoS One. 2015 Jun 19;10(6):e0127801. doi: 10.1371/journal.pone.0127801. eCollection 2015. PLoS One. 2015. PMID: 26091288 Free PMC article.
-
Genetically Encoded Fluorescent Biosensors Illuminate the Spatiotemporal Regulation of Signaling Networks.Chem Rev. 2018 Dec 26;118(24):11707-11794. doi: 10.1021/acs.chemrev.8b00333. Epub 2018 Dec 14. Chem Rev. 2018. PMID: 30550275 Free PMC article. Review.
-
TPC2 controls pigmentation by regulating melanosome pH and size.Proc Natl Acad Sci U S A. 2016 May 17;113(20):5622-7. doi: 10.1073/pnas.1600108113. Epub 2016 May 2. Proc Natl Acad Sci U S A. 2016. PMID: 27140606 Free PMC article.
-
Perspectives on: SGP symposium on mitochondrial physiology and medicine: the renaissance of mitochondrial pH.J Gen Physiol. 2012 Jun;139(6):415-23. doi: 10.1085/jgp.201110767. J Gen Physiol. 2012. PMID: 22641636 Free PMC article. Review. No abstract available.
-
Bacterial N-Glycosylation Efficiency Is Dependent on the Structural Context of Target Sequons.J Biol Chem. 2016 Oct 14;291(42):22001-22010. doi: 10.1074/jbc.M116.747121. Epub 2016 Aug 29. J Biol Chem. 2016. PMID: 27573243 Free PMC article.
References
-
- Griffith D. A., Jarvis S. M. (1996) Biochim. Biophys. Acta 1286, 153–181 - PubMed
-
- Young J. D., Cheeseman C. I., Mackey J. R., Cass C. E., Baldwin S. A. (2000) in Gastrointestinal Transport (Current Topics in Membranes) (Barrett K. E., Donowitz M. eds) pp. 329–378, Academic Press,San Diego
-
- Elwi A. N., Damaraju V. L., Baldwin S. A., Young J. D., Sawyer M. B., Cass C. E. (2006) Biochem. Cell Biol. 84, 844–858 - PubMed
-
- King A. E., Ackley M. A., Cass C. E., Young J. D., Baldwin S. A. (2006) Trends Pharmacol. Sci. 27, 416–425 - PubMed
-
- Zhang J., Visser F., King K. M., Baldwin S. A., Young J. D., Cass C. E. (2007) Cancer Metastasis Rev. 26, 85–110 - PubMed
Publication types
MeSH terms
Substances
LinkOut - more resources
Full Text Sources
Other Literature Sources
Research Materials
Miscellaneous
