. 2009 Jun 3;29(22):7278-89.
doi: 10.1523/JNEUROSCI.1479-09.2009.

Lateral intraparietal cortex and reinforcement learning during a mixed-strategy game

Affiliations

Lateral intraparietal cortex and reinforcement learning during a mixed-strategy game

Hyojung Seo et al. J Neurosci. .

Abstract

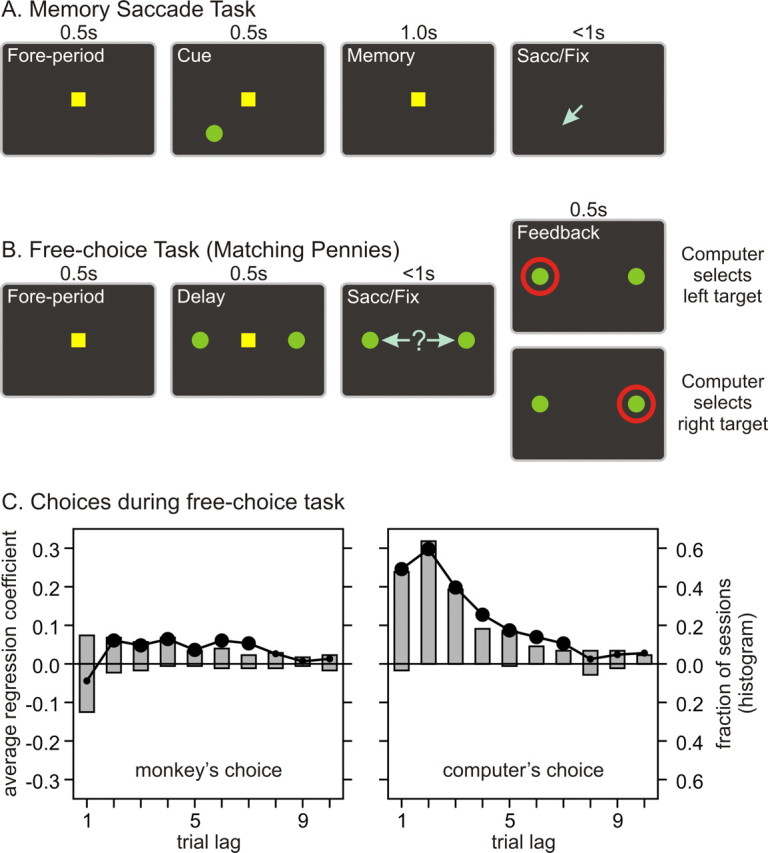
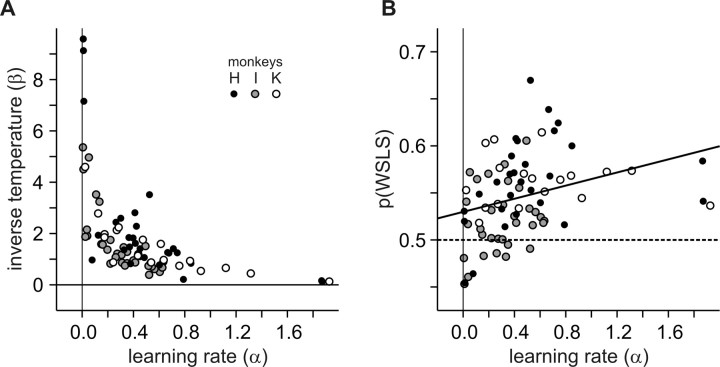
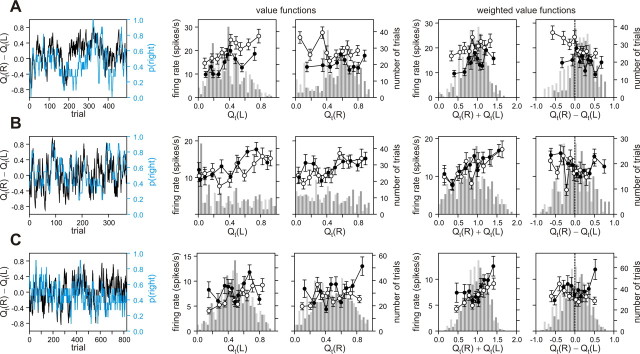
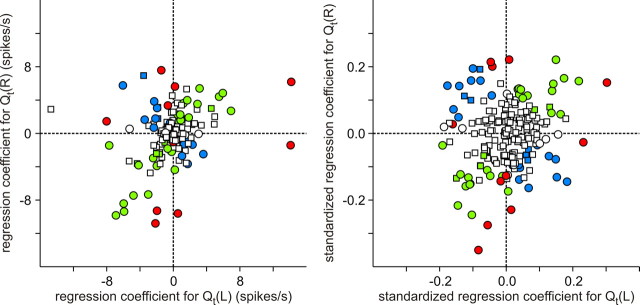
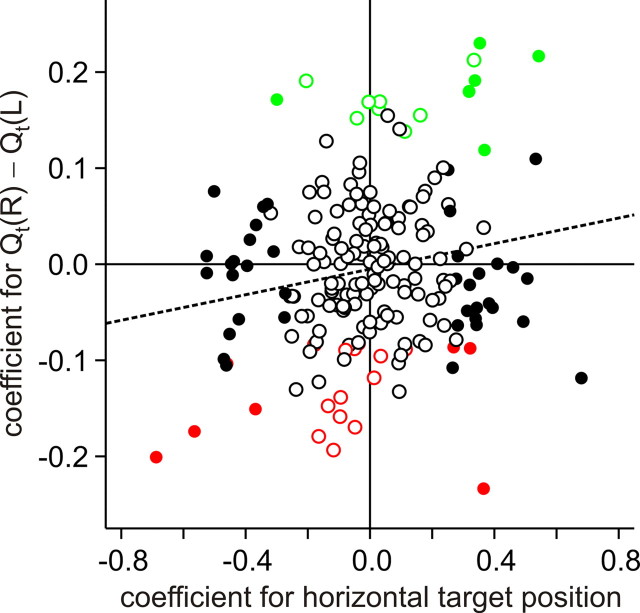
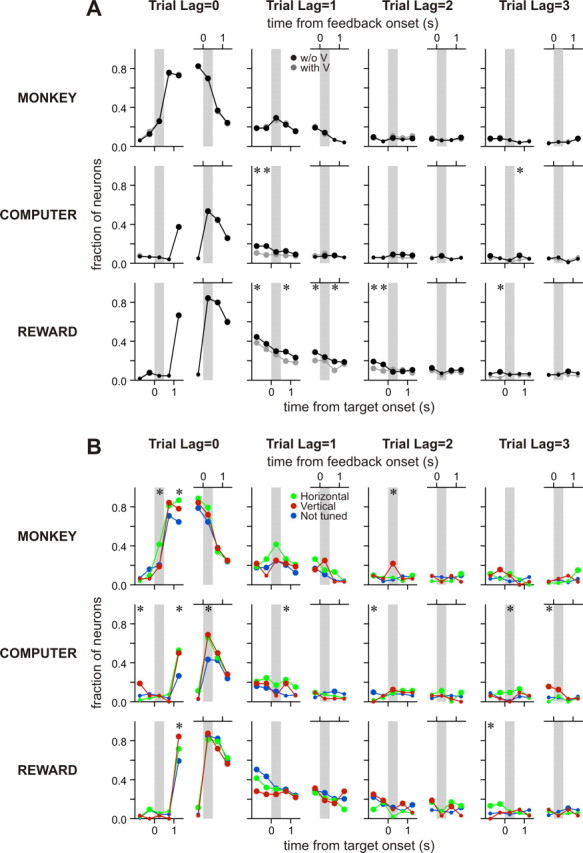
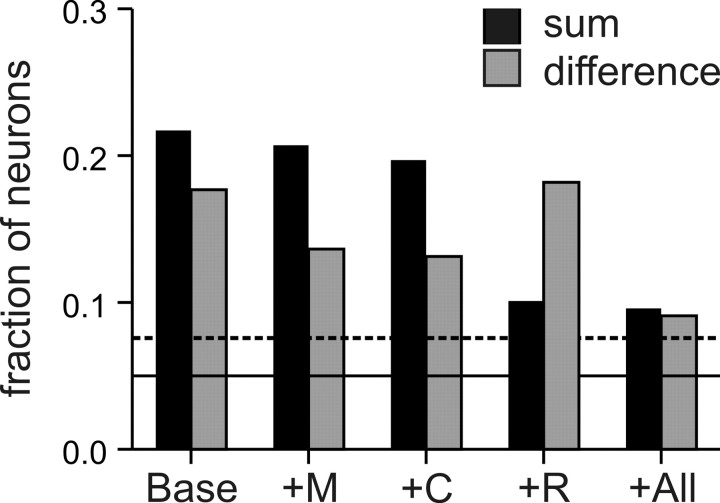
Activity of the neurons in the lateral intraparietal cortex (LIP) displays a mixture of sensory, motor, and memory signals. Moreover, they often encode signals reflecting the accumulation of sensory evidence that certain eye movements might lead to a desirable outcome. However, when the environment changes dynamically, animals are also required to combine the information about its previously chosen actions and their outcomes appropriately to update continually the desirabilities of alternative actions. Here, we investigated whether LIP neurons encoded signals necessary to update an animal's decision-making strategies adaptively during a computer-simulated matching-pennies game. Using a reinforcement learning algorithm, we estimated the value functions that best predicted the animal's choices on a trial-by-trial basis. We found that, immediately before the animal revealed its choice, approximately 18% of LIP neurons changed their activity according to the difference in the value functions for the two targets. In addition, a somewhat higher fraction of LIP neurons displayed signals related to the sum of the value functions, which might correspond to the state value function or an average rate of reward used as a reference point. Similar to the neurons in the prefrontal cortex, many LIP neurons also encoded the signals related to the animal's previous choices. Thus, the posterior parietal cortex might be a part of the network that provides the substrate for forming appropriate associations between actions and outcomes.


Figures

Figure 1.
Figure 1.
Behavioral tasks and performance. A, Memory saccade task. B, Free-choice task that simulated a matching-pennies game. C, Average regression coefficients associated with the choices of the animal (left) and the computer opponent (right) in multiple previous trials. Large symbols indicate that the corresponding values were significantly different from 0 (two-tailed t test, p < 0.05). Histograms indicate the fraction of daily sessions in which a given regression coefficient was significantly different from 0 (two-tailed t test, p < 0.05). Sacc/Fix, Saccade/fixation.
Figure 2.
Figure 2.
Parameters of reinforcement learning model. A, Inverse temperature (β) plotted against the learning rate (α) estimated from the same testing session. B, The probability that the animal would use the win–stay–lose–switch strategy is plotted against the learning rate (α).
Figure 3.
Figure 3.
Three example LIP neurons showing significant changes in their activity according to value functions (A–C). For each neuron, the leftmost column shows the difference between the value functions for the two targets (black) and the fraction of trials in which the animal chose the rightward target estimated by the moving average of 10 successive trials. The next two columns show the average spike rates during the delay period of the free-choice task for each decile of trials sorted by the value function for the leftward or rightward target. This was computed separately according to the target chosen by the animal (open circles, leftward target; filled circles, rightward target). The last two columns show the activity of the same neuron for the sum of the value functions and their difference in the same format. Light and dark gray histograms show the distribution of trials in which the animal chose the leftward and rightward targets, respectively.
Figure 4.
Figure 4.
Effect of value functions on LIP activity. Raw (left) and standardized (right) regression coefficients associated with the value functions for leftward (abscissa) and rightward (ordinate) targets. Circles correspond to the neurons in which the effect of the value function was significant for at least one target, whereas squares indicate the neurons in which the effect of value function was not significant for either target. Green and blue symbols indicate the neurons in which the activity was significantly influenced by either the sum of the value functions or their difference, respectively, whereas the red symbols indicate the neurons in which the activity was significantly influenced by both. Empty symbols indicate the neurons in which neither variable had a significant effect.
Figure 5.
Figure 5.
Relationship between the spatial tuning during the memory period of the memory saccade task and the activity related to the difference in the value functions. For each LIP neuron, standardized regression coefficient for the difference in the value functions (ordinate) is plotted against standardized regression coefficient for the horizontal target position during the memory saccade task. These coefficients were estimated from the delay period of the free-choice task and the memory period of the memory saccade task, respectively. Filled symbols indicate the neurons that are horizontally tuned, whereas green (red) symbols indicate the neurons in which the coefficient for the difference in the value functions, Qt(R) − Qt(L), was significantly positive (negative).
Figure 6.
Figure 6.
Activity of the same neuron illustrated in Figure 3A that showed significant modulation in their activity during the delay period according to the animal's choice and reward in the previous trial. A pair of spike density functions in each panel indicates the average activity sorted by the animal's choice (top), the choice of the computer opponent (middle), or the reward received by the animal (bottom) in the current (Trial Lag = 0) or previous three (Trial Lag = 1 to 3) trials. The activity during the trials in which the rightward (leftward) target was chosen or in which the animal was rewarded (unrewarded) is indicated by the green (black) line. Red symbols indicate the regression coefficient associated with each variable during each 0.5 s window used in the regression analysis. Large symbols indicate that the regression coefficient was significantly different from 0 (t test, p < 0.05). Gray background corresponds to the delay period (left columns) or feedback period (right columns).
Figure 7.
Figure 7.
Activity of an LIP neuron that showed vertically tuned activity during the memory period of the memory saccade trials. Same format as in Figure 6.
Figure 8.
Figure 8.
Activity of an LIP neuron that was not directionally tuned during the memory period of the memory saccade trials. Same format as in Figure 6.
Figure 9.
Figure 9.
Population summary of LIP activity related to choices and outcomes. A, Fraction of LIP neurons that showed significant changes in their activity according to the animal's choice (top), the choice of the computer opponent (middle), and the reward in the current (Trial Lag = 0) or previous (Trial Lag = 1 to 3) trials. The statistical significance was determined using a linear regression model applied to the spike rates in a series of nonoverlapping 0.5 s window aligned to target onset (left columns) or feedback onset (right columns). Gray symbols show the results obtained from the regression model that also included the value functions, and the asterisks indicate that they are significantly different from the results obtained from the regression model without the value functions (black symbols; χ2 test, p < 0.05). B, Same results shown in A from the regression model without the value functions, sorted separately according to the tuning property of each neuron. Asterisks indicate that the values among the horizontally tuned (green), vertically tuned (red), and untuned (blue) neurons were significantly different (χ2 test, p < 0.05). Gray background corresponds to the delay period (left columns) or feedback period (right columns).
Figure 10.
Figure 10.
Fraction of LIP neurons that significantly changed their activity according to the sum of the value functions (black) or their difference (gray). Base, The results from the regression model that only included the animal's choice and the value functions in the same trial; +M, +C, +R, the results obtained from the regression model that also include the choice of the animal (computer's choice, reward) in the previous trial; +All, the results from the model including all three variables. Solid and dotted horizontal lines correspond to the 5% significance level and the minimum value significantly higher than 5%.

Similar articles

Cited by

References

    1. Amiez C, Joseph JP, Procyk E. Reward encoding in the monkey anterior cingulate cortex. Cereb Cortex. 2006;16:1040–1055. - PMC - PubMed
    1. Barash S, Bracewell RM, Fogassi L, Gnadt JW, Andersen RA. Saccade-related activity in the lateral intraparietal area. I. Temporal properties; comparison with area 7a. J Neurophysiol. 1991;66:1095–1108. - PubMed
    1. Barraclough DJ, Conroy ML, Lee D. Prefrontal cortex and decision making in a mixed-strategy game. Nat Neurosci. 2004;7:404–410. - PubMed
    1. Belova MA, Paton JJ, Salzman CD. Moment-to-moment tracking of state value in the amygdala. J Neurosci. 2008;28:10023–10030. - PMC - PubMed
    1. Burnham KP, Anderson DR. A practical information-theoretic approach. Ed 2. New York: Springer; 2002. Model selection and multimodel inference.

Publication types