. 2009 Aug;37(14):e98.
doi: 10.1093/nar/gkp480. Epub 2009 Jun 3.

Studying vertebrate topoisomerase 2 function using a conditional knockdown system in DT40 cells

Affiliations

Studying vertebrate topoisomerase 2 function using a conditional knockdown system in DT40 cells

Mark Johnson et al. Nucleic Acids Res. 2009 Aug.

Abstract

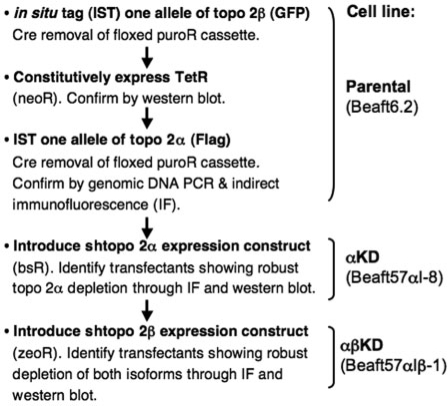
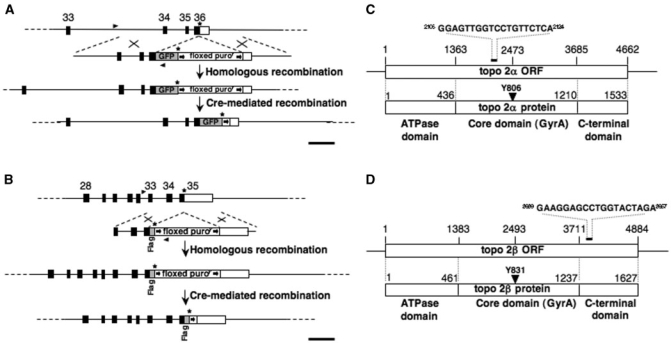
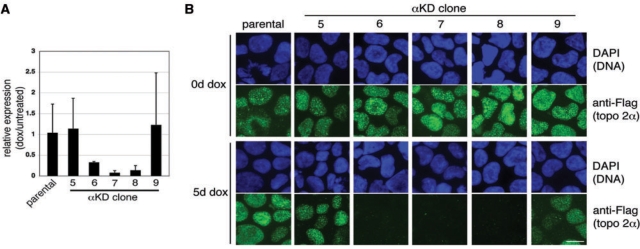
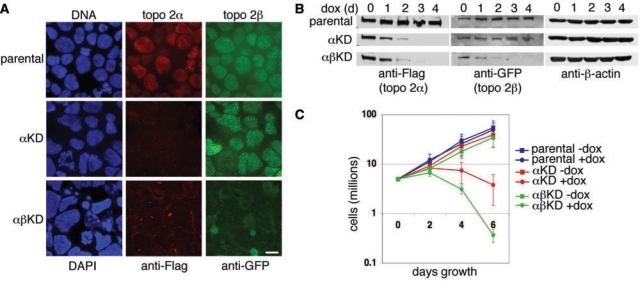
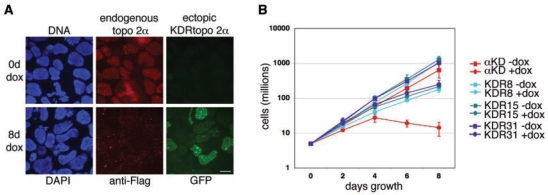
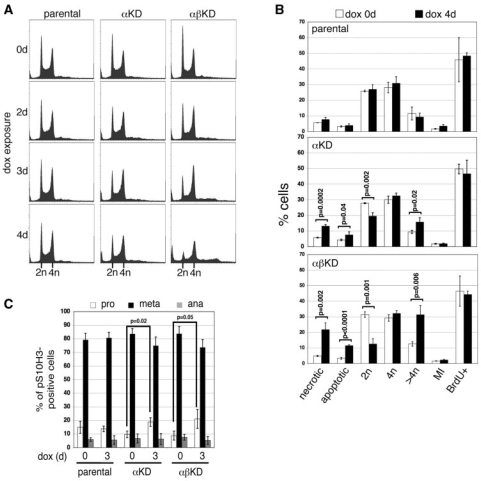
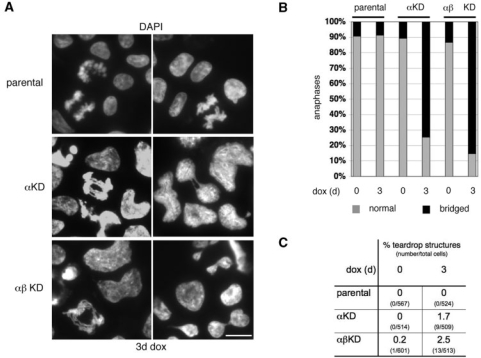
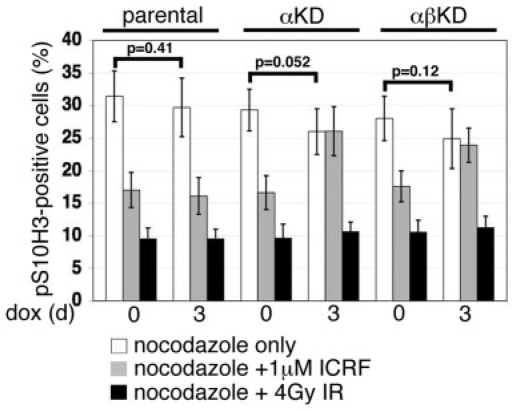
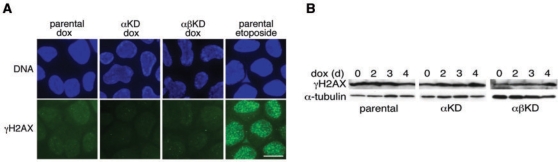
DT40 is a B-cell lymphoma-derived avian cell line widely used to study cell autonomous gene function because of the high rates with which DNA constructs are homologously recombined into its genome. Here, we demonstrate that the power of the DT40 system can be extended yet further through the use of RNA interference as an alternative to gene targeting. We have generated and characterized stable DT40 transfectants in which both topo 2 genes have been in situ tagged using gene targeting, and from which the mRNA of both topoisomerase 2 isoforms can be conditionally depleted through the tetracycline-induced expression of short hairpin RNAs. The cell cycle phenotype of topo 2-depleted DT40 cells has been compared with that previously reported for other vertebrate cells depleted either of topo 2alpha through gene targeting, or depleted of both isoforms simultaneously by transient RNAi. In addition, the DT40 knockdown system has been used to explore whether excess catenation arising through topo 2 depletion is sufficient to trigger the G2 catenation (or decatenation) checkpoint, proposed to exist in differentiated vertebrate cells.


Figures

Figure 1.
Figure 1.
Stepwise-strategy for the generation of stable conditional topo 2α and 2β knockdown DT40 cell lines.
Figure 2.
Figure 2.
(A) Map showing the 3′ region of the Gallus gallus topo 2β genomic locus and the GFP in situ tagging (IST) construct. A homologous recombination event will result in exon 36, which contains the stop codon, being disrupted, such that the portion encoding the final part of the 2β open reading frame is fused in-frame to sequence encoding eGFP, followed by a stop codon, a floxed puromycin-resistance gene cassette and sequence from the 3′ homology block. (B) Map showing the 3′ region of the chicken topo 2α genomic locus and the Flag IST construct. In the event of gene targeting, exon 35, which contains the stop codon, will be disrupted such that the protein-encoding portion of the exon is fused in-frame to a Flag epitope. This is immediately followed by a stop codon, the floxed puroR marker and sequence from the 3′ homology block. In each case, homologously recombined clones were initially identified by PCR of genomic DNA amplified using forward primers (arrowheads) lying 5′ to the homology blocks and with reverse primers based on the GFP or puroR genes. In targeted-tagged clones, the floxed puroR gene was removed by transient expression of Cre recombinase. Black boxes represent the position of exons. Exon numbering is based on the Gallus gallus reference sequence assembly 2.1. Scale bar, 1 kb. (C) Schematic showing the Gallus gallus topo 2α mRNA and its open reading frame (ORF), the various domains of the protein and the position of the RNAi target sequence (5). (D) Schematic showing the Gallus gallus topo 2β mRNA and ORF, the various domains of the protein and the position of the RNAi target sequence (5).
Figure 3.
Figure 3.
(A) Real-time PCR was used to estimate the level of topo 2α mRNA knockdown in several transfectants, five of which are shown here. Each bar represents the expression level in cells exposed to dox (5 days) relative to that in untreated cells from the same cell line, calculated using the Comparative CT (ΔΔCT) method (mean ± SD, based on ≥2 independent experiments). (B) In parallel, the same transfectants were examined by indirect IF using anti-Flag (FITC) to detect protein from the in situ tagged topo 2α locus. DNA was counterstained with DAPI (blue). Scale bar, 10 μm.
Figure 4.
Figure 4.
(A) Indirect IF of topo 2α and topo 2β in the parental, αKD and αβKD cell lines after 6 days dox exposure. Cells were cytospun onto slides. Topo 2α was detected using anti-Flag antibody (Texas Red) and topo 2β using anti-GFP (FITC). DNA was counterstained using DAPI (blue). Scale bar, 10 μm. (B) Western blots showing robust knockdown, over 4 days dox exposure, of topo 2α in αKD cells and of both isoforms in αβKD cells. Topo 2α was detected using anti-Flag antibody and 2β using anti-GFP. β-actin was used as a loading control. (C) Growth curves of the parental (blue), αKD (red) and αβKD (green) cell lines grown in the presence (closed circles) and absence (closed squares) of 2.5 μg ml–1 dox for 6 days. Data points represent the mean (±SD) based on ≥3 independent experiments.
Figure 5.
Figure 5.
(A) Detection of endogenous and ectopically expressed topo 2α in a knockdown-resistant (KDR) derivative of the αKD cell line. The KDR line was grown in the presence or absence of 2.5 μg ml–1 dox for 8 days, cells fixed and cytopsun onto slides. Endogenous topo 2α was detected indirectly using anti-Flag (Texas Red). The green signal of the ectopically expressed GFP:KDRtopo2α fusion protein was visualized directly (green). (Note: the background level of expression from the endogenous GFP-tagged topo 2β locus is extremely faint when visualized directly.) Scale bar, 10 μm. (B) Growth curves of the αKD cell line compared with three KDR clonal derivatives, grown in the presence or absence of 2.5 μg ml–1 dox for 8 days. Data points represent the mean (±SD) based on ≥3 independent experiments.
Figure 6.
Figure 6.
(A) Flow cytometric analysis of nuclear DNA content of the parental, αKD and αβKD cell lines over a 4-day exposure to 2.5 μg ml–1 dox: x-axis, propidium iodide fluorescence; y-axis, events (total events 30 000). (B) Summary graph of flow cytometric cell cycle data collected from the parental, αKD and αβKD cell lines at 0 (white bars) and 4 days (black) dox. Data represents the mean (±SD) based on ≥3 independent experiments. (C) Breakdown of M phase cells (into prophase, prometa/metaphase and anaphase) at 0 and 3 days dox based on microscopic examination. Data points are the mean (±SD) of three experiments and are based on >300 pS10H3-positive cells.
Figure 7.
Figure 7.
(A) Representative examples of anaphase chromatin bridging and teardrop structures suggestive of aberrant cytokineses in αKD and αβKD cells depleted of topo 2 (3 days dox). DNA has been stained with DAPI. Scale bar, 10 μm. (B) Summary graph of the frequency of anaphase bridging after 3 days dox. Data points are based on three experiments, with a total of >150 anaphases examined. (C) Detection of occasional ‘teardrop’ structures in topo 2-depleted (3 days dox) DT40 cells.
Figure 8.
Figure 8.
Summary graph of the accumulation of cells staining positive for the mitotic marker pS10H3 (quantified by flow cytometry) after 8 h in the presence of nocodazole, in cultures treated with dox for 0 or 3 days (based on nine independent experiments) (white bars). The impact of 1 μM ICRF-193 (present throughout the 8-h period with nocodazole) on progression into M phase is shown alongside (three independent experiments) (grey bars). To address whether topo 2 depletion has any effect on the ability of DT40 cells to arrest in G2 in response to DSBs, cultures were exposed to 4 Gy of X-irradiation immediately prior to nocodazole addition (three independent experiments) (black bars). Values correspond to the means (±SD).
Figure 9.
Figure 9.
(A) As a measure of levels of DSBs after 3 days dox exposure, parental, αKD and αβKD cells were examined by indirect IF for phosphorylated histone H2AX (γH2AX)-containing foci (FITC) in the cell nuclei. As a positive control, the parental cell line was exposed briefly to the topo 2 poison etoposide (10 μM, 30 min). DNA is counterstained with DAPI. Scale bar, 10 μm. (B) Western blot of γH2AX levels over a 4-day time course of dox exposure. α-tubulin is the loading control.

References

    1. Buerstedde JM, Takeda S. Reviews and protocols in DT40 research. Subcell. Biochem. 2006;40:1–477. - PubMed
    1. Hudson DF, Morrison C, Ruchaud S, Earnshaw WC. Reverse genetics of essential genes in tissue-culture cells: ‘dead cells talking'. Trends Cell Biol. 2002;12:281–287. - PubMed
    1. Martin SE, Caplen NJ. Applications of RNA interference in mammalian systems. Annu. Rev. Genomics Hum. Genet. 2007;8:81–108. - PubMed
    1. Chung TD, Drake FH, Tan KB, Per SR, Crooke ST, Mirabelli CK. Characterization and immunological identification of cDNA clones encoding two human DNA topoisomerase II isozymes. Proc. Natl Acad. Sci. USA. 1989;86:9431–9435. - PMC - PubMed
    1. Niimi A, Suka N, Harata M, Kikuchi A, Mizuno S. Co-localization of chicken DNA topoisomerase IIalpha, but not beta, with sites of DNA replication and possible involvement of a C-terminal region of alpha through its binding to PCNA. Chromosoma. 2001;110:102–114. - PubMed

Publication types