Enhanced airway inflammation and remodeling in adenosine deaminase-deficient mice lacking the A2B adenosine receptor
- PMID: 19494329
- PMCID: PMC3631106
- DOI: 10.4049/jimmunol.0900515
Enhanced airway inflammation and remodeling in adenosine deaminase-deficient mice lacking the A2B adenosine receptor
Abstract
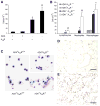
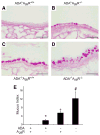
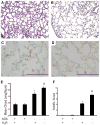
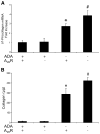
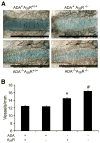
Adenosine is a signaling nucleoside that is generated in response to cellular injury and orchestrates the balance between tissue protection and the progression to pathological tissue remodeling. Adenosine deaminase (ADA)-deficient mice develop progressive airway inflammation and remodeling in association with adenosine elevations, suggesting that adenosine can promote features of chronic lung disease. Furthermore, pharmacological studies in ADA-deficient mice demonstrate that A(2B)R antagonism can attenuate features of chronic lung disease, implicating this receptor in the progression of chronic lung disease. This study examines the contribution of A(2B)R signaling in this model by generating ADA/A(2B)R double-knockout mice. Our hypothesis was that genetic removal of the A(2B)R from ADA-deficient mice would lead to diminished pulmonary inflammation and damage. Unexpectedly, ADA/A(2B)R double-knockout mice exhibited enhanced pulmonary inflammation and airway destruction. Marked loss of pulmonary barrier function and excessive airway neutrophilia are thought to contribute to the enhanced tissue damage observed. These findings support an important protective role for A(2B)R signaling during acute stages of lung disease.
Figures




Similar articles
-
Genetic removal of the A2A adenosine receptor enhances pulmonary inflammation, mucin production, and angiogenesis in adenosine deaminase-deficient mice.Am J Physiol Lung Cell Mol Physiol. 2007 Sep;293(3):L753-61. doi: 10.1152/ajplung.00187.2007. Epub 2007 Jun 29. Am J Physiol Lung Cell Mol Physiol. 2007. PMID: 17601796
-
Distinct roles for the A2B adenosine receptor in acute and chronic stages of bleomycin-induced lung injury.J Immunol. 2011 Jan 15;186(2):1097-106. doi: 10.4049/jimmunol.1002907. Epub 2010 Dec 13. J Immunol. 2011. PMID: 21149612 Free PMC article.
-
Attenuation of chronic pulmonary inflammation in A2B adenosine receptor knockout mice.Am J Respir Cell Mol Biol. 2010 May;42(5):564-71. doi: 10.1165/rcmb.2008-0391OC. Epub 2009 Jun 25. Am J Respir Cell Mol Biol. 2010. PMID: 19556606 Free PMC article.
-
Adenosine deaminase deficiency: metabolic basis of immune deficiency and pulmonary inflammation.Adv Immunol. 2005;86:1-41. doi: 10.1016/S0065-2776(04)86001-2. Adv Immunol. 2005. PMID: 15705418 Review.
-
Too much of a good thing: adenosine overload in adenosine-deaminase-deficient mice.Trends Pharmacol Sci. 2003 Feb;24(2):66-70. doi: 10.1016/S0165-6147(02)00045-7. Trends Pharmacol Sci. 2003. PMID: 12559769 Review.
Cited by
-
Identification of hypoxia-inducible factor HIF-1A as transcriptional regulator of the A2B adenosine receptor during acute lung injury.J Immunol. 2014 Feb 1;192(3):1249-56. doi: 10.4049/jimmunol.1100593. Epub 2014 Jan 3. J Immunol. 2014. PMID: 24391213 Free PMC article.
-
The Many Faces of the A2b Adenosine Receptor in Cardiovascular and Metabolic Diseases.J Cell Physiol. 2015 Dec;230(12):2891-7. doi: 10.1002/jcp.25043. J Cell Physiol. 2015. PMID: 25975415 Free PMC article. Review.
-
Crosstalk between the equilibrative nucleoside transporter ENT2 and alveolar Adora2b adenosine receptors dampens acute lung injury.FASEB J. 2013 Aug;27(8):3078-89. doi: 10.1096/fj.13-228551. Epub 2013 Apr 19. FASEB J. 2013. PMID: 23603835 Free PMC article.
-
Effects of cigarette smoke on pulmonary endothelial cells.Am J Physiol Lung Cell Mol Physiol. 2018 May 1;314(5):L743-L756. doi: 10.1152/ajplung.00373.2017. Epub 2018 Jan 4. Am J Physiol Lung Cell Mol Physiol. 2018. PMID: 29351435 Free PMC article. Review.
-
The resurgence of A2B adenosine receptor signaling.Biochim Biophys Acta. 2011 May;1808(5):1329-39. doi: 10.1016/j.bbamem.2010.05.016. Epub 2010 May 28. Biochim Biophys Acta. 2011. PMID: 20546702 Free PMC article. Review.
References
-
- Thannickal VJ, Toews GB, White ES, Lynch JP, 3rd, Martinez FJ. Mechanisms of pulmonary fibrosis. Annu Rev Med. 2004;55:395–417. - PubMed
-
- Sime PJ, O’Reilly KM. Fibrosis of the lung and other tissues: new concepts in pathogenesis and treatment. Clin Immunol. 2001;99:308–319. - PubMed
-
- Tillie-Leblond I, Pugin J, Marquette CH, Lamblin C, Saulnier F, Brichet A, Wallaert B, Tonnel AB, Gosset P. Balance between proinflammatory cytokines and their inhibitors in bronchial lavage from patients with status asthmaticus. Am J Respir Crit Care Med. 1999;159:487–494. - PubMed
Publication types
MeSH terms
Substances
Grants and funding
LinkOut - more resources
Full Text Sources
Other Literature Sources
Medical
Molecular Biology Databases
Research Materials

