. 2009 Jun 4;4(6):e5803.
doi: 10.1371/journal.pone.0005803.

Heme oxygenase-1 accelerates cutaneous wound healing in mice

Affiliations

Heme oxygenase-1 accelerates cutaneous wound healing in mice

Anna Grochot-Przeczek et al. PLoS One. .

Abstract

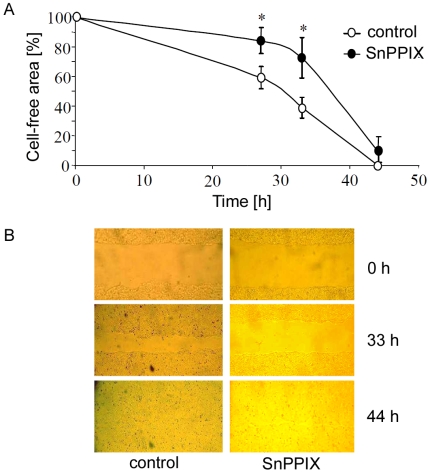
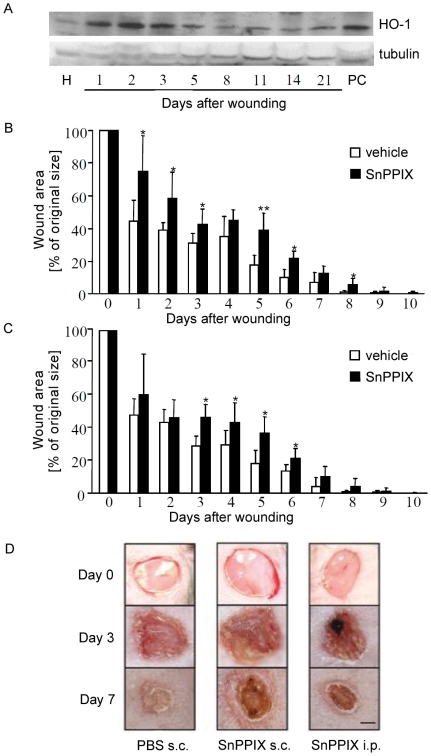
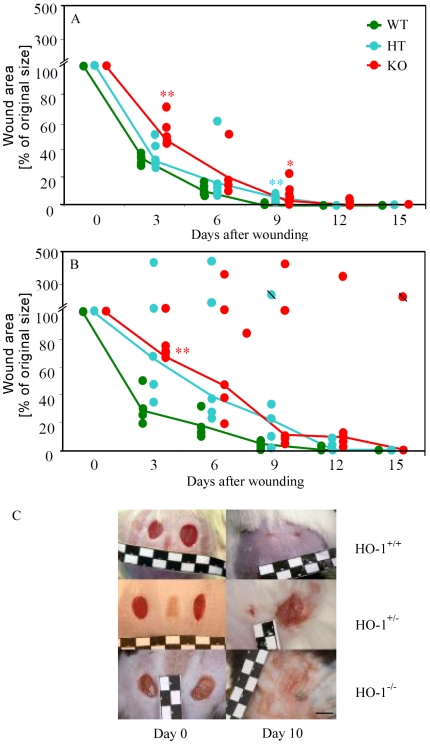
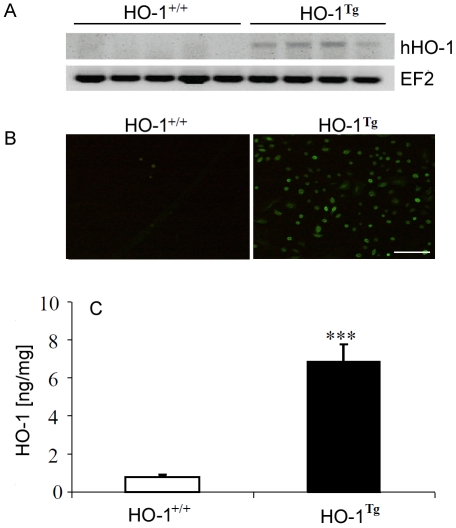
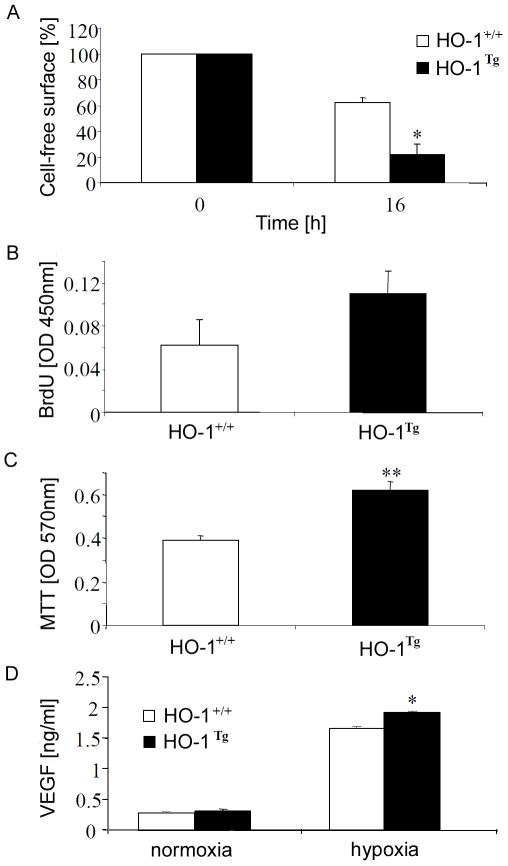
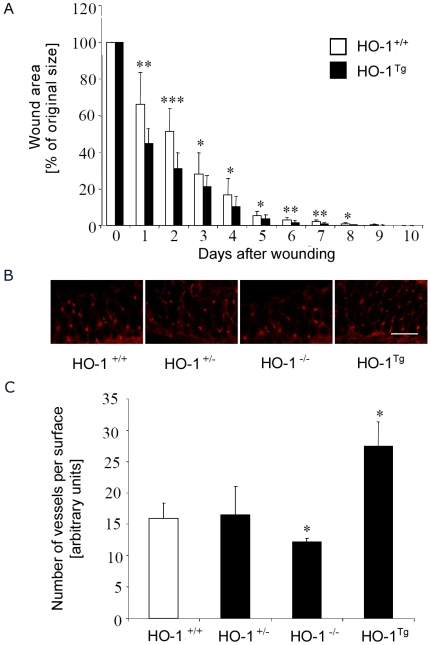
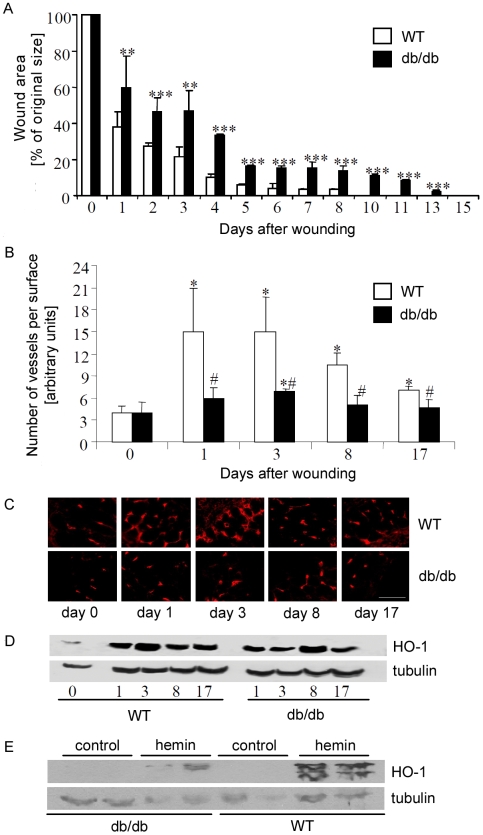
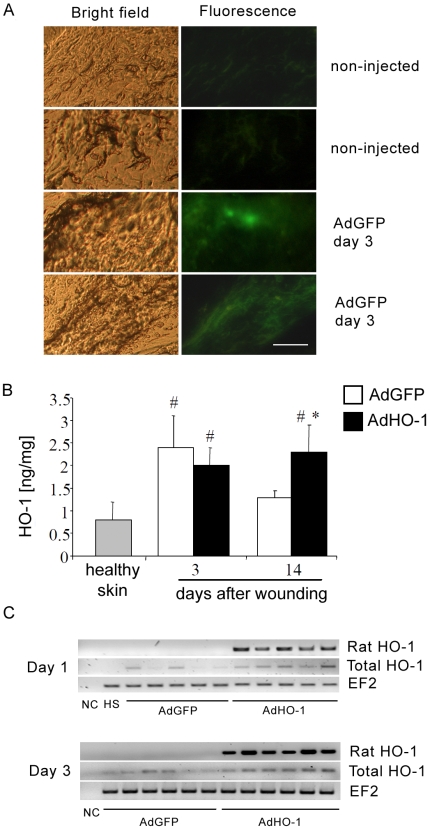
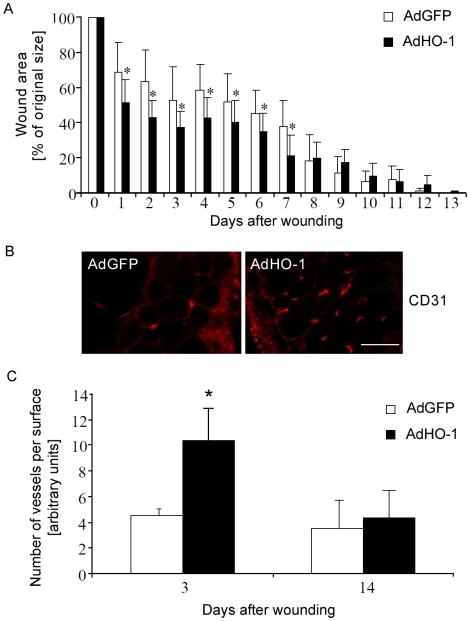
Heme oxygenase-1 (HO-1), a cytoprotective, pro-angiogenic and anti-inflammatory enzyme, is strongly induced in injured tissues. Our aim was to clarify its role in cutaneous wound healing. In wild type mice, maximal expression of HO-1 in the skin was observed on the 2(nd) and 3(rd) days after wounding. Inhibition of HO-1 by tin protoporphyrin-IX resulted in retardation of wound closure. Healing was also delayed in HO-1 deficient mice, where lack of HO-1 could lead to complete suppression of reepithelialization and to formation of extensive skin lesions, accompanied by impaired neovascularization. Experiments performed in transgenic mice bearing HO-1 under control of keratin 14 promoter showed that increased level of HO-1 in keratinocytes is enough to improve the neovascularization and hasten the closure of wounds. Importantly, induction of HO-1 in wounded skin was relatively weak and delayed in diabetic (db/db) mice, in which also angiogenesis and wound closure were impaired. In such animals local delivery of HO-1 transgene using adenoviral vectors accelerated the wound healing and increased the vascularization. In summary, induction of HO-1 is necessary for efficient wound closure and neovascularization. Impaired wound healing in diabetic mice may be associated with delayed HO-1 upregulation and can be improved by HO-1 gene transfer.


Conflict of interest statement

Competing Interests: The authors have declared that no competing interests exist.

Figures

Figure 1
Figure 1. Effect of SnPPIX (10 µmol/L) on time of gap closure by HaCaT cells cultured in vitro in the presence of hydroxyurea (10 mmol/L).
Scratch assay. A – Quantitative data. Each point represents mean±SD of 3 experiments done in duplicates. * P<0.05 in comparison to control. B – representative pictures. Scale bar = 200 µm.
Figure 2
Figure 2. A - Expression of HO-1 protein in healthy and wounded skin.
H - healthy skin, PC - positive control (HaCaT cells stimulated with 10 µmol/L of hemin for 24 h). Western blot analysis. Tubulin was used as a housekeeping gene to control the protein loading. One of 3 similar blots. B - Effect of SnPPIX (45 µmol/kg of body weight) injected subcutaneously (once a day for 10 days) on wound closure in C57BL mice. C – Effect of SnPPIX (45 µmol/kg of body weight), injected intraperitoneally (once a day for 10 days) on wound closure in C57BL mice. Each bar represents mean+SD; N = 10 animals per group. * P<0.05, ** P<0.01 in comparison to control, vehicle injected animals. D – representative pictures taken immediately after wounding, and on the 3rd and 7th days. Scale bar = 1 mm.
Figure 3
Figure 3. Closure of cuteneous wounds in the HO-1+/+ (WT), HO-1+/− (HT), or HO-1−/− (KO) C57BLxFVB mice.
A – 3-month old animals. B – 6-month old animals. Each point represents individual animal (N = 4–5), lines connect the median values. Crossed points represent animals subjected to euthanasia. * P<0.05, ** P<0.01 in comparison to WT. C – representative pictures showing the wounds in 6-month old animals immediately after wounding and on day 10th. Scale bar = 5 mm.
Figure 4
Figure 4. HO-1 overexpression in murine keratinocytes.
A – Expression of human HO-1 mRNA in the skin of HO-1+/+ and transgenic HO-1Tg mice C57BL mice. Electrophoresis of RT-PCR products (2% agarose gel). EF2 was used as a housekeeping gene. One of 4 similar analyses. B – Representative pictures of immunocytofluorescent staining for HO-1 in primary murine keratinocytes isolated from newborns and cultured in vitro. Scale bar = 100 µm. C – Concentration of HO-1 in lysates of primary murine keratinocytes isolated from newborns and cultured in vitro. ELISA. Each bar represents mean+SD of 6 measurements. *** P<0.001 in comparison to HO-1+/+.
Figure 5
Figure 5. Activity of primary murine keratinocytes isolated from HO-1+/+ and HO-1Tg newborns and cultured in vitro.
A – Migration of cells measured by time of gap closure in the presence of hydroxyurea (10 mmol/L). Scratch assay. B – Spontaneous proliferation of cells cultured for 48 h. BrdU incorporation assay. C – Viability of cells cultured in hypoxia (1% O2) for 24 h. MTT reduction assay. D – Concentration of VEGF in media harvested from cell cultures after a 24 h incubation. Each bar represents mean+SD of 3–5 experiments. * P<0.05, ** P<0.01 in comparison to HO-1+/+.
Figure 6
Figure 6. A – Closure of cutaneous wounds in the HO-1+/+ wild type and HO-1Tg mice.
Each bar represents mean+SD. N = 10 animals per group. * P<0.05, ** P<0.01, *** P<0.001 in comparison to HO-1+/+ mice. B – Representative pictures demonstrating CD31 staining of endothelial cells in the wounded skin (3 days after wounding) in the 3-month old mice of different genotypes. Scale bar = 100 µm. C – Number of vessels in wounded skin (3 days after wounding, CD31 staining) in the 3-month old mice of different genotypes. Each bar represents analysis of samples from 5–8 animals. Data are presented as mean+SD. * P<0.05 in comparison to HO-1+/+ animals.
Figure 7
Figure 7. A – Closure of cutaneous wounds in the wild type (WT) and db/db diabetic C57BL mice.
Each bar represents mean+SD; N = 10 animals per group. ** P<0.01, *** P<0.001 in comparison to WT animals. B – Number of vessels in healthy and wounded skin in the WT and db/db mice. Each bar represents analysis of samples from 10 animals. Data are presented as mean+SD. * P<0.05 in comparison to healthy skin (day 0); # P<0.05 in comparison to WT animals. C – Representative pictures showing blood vessels in healthy and wounded skin of WT and db/db mice. Immunohistochemical staining for CD31. Scale bar = 100 µm. D – Western blot analysis of HO-1 protein expression in healthy and wounded skin of the WT and db/db mice. One of 5 similar blots. E – Western blot analysis of HO-1 protein expression in healthy skin of the wild type and db/db mice 24 h after intradermal injection with hemin (10 mg/kg of body weight). One of 2 similar blots. Tubulin was used as a housekeeping gene to control the protein loading.
Figure 8
Figure 8. Expression of GFP and HO-1 transgenes in skin.
A – Representative pictures showing the expression of GFP in the wounded skin of db/db diabetic mice, 3 days after local injection with AdGFP adenoviral vectors (2.3×10⁷ IU). Bright field and fluorescence microscopy. Scale bar = 100 µm. B – Concentration of HO-1 protein in tissue lysates of healthy and wounded skin of db/db mice, measure on the 3rd and 14th days after AdGFP and AdHO-1 vector delivery. Each bar represent mean+SD for 5–8 animals. # P<0.05 in comparison to healthy skin; * P<0.05 in comparison to AdGFP injected animals. C – RT-PCR analysis of rat HO-1 mRNA and total (rat/murine) mRNA in wounded skin, measured on the 1st and 3rd days after AdGFP and AdHO-1 vector delivery. Electrophoresis of RT-PCR products in 2% agarose gel. NC-negative control, HS-healthy skin.
Figure 9
Figure 9. Effect of HO-1 transgene delivery on wounds.
A – Effect of HO-1 transgene delivery on wound closure in the db/db diabetic mice. Adenoviral vectors (2.3×10⁷ IU in 100 µL of PBS) were injected subcutaneously near the wound immediately after injury. Control animal were injected with the same amount of AdGFP carriers. Each bar represents mean+SD; N = 5–8 animals per group. * P<0.05 in comparison to control, AdGFP treated mice. B – representative pictures showing blood vessels in the wounded skin of db/db mice injected with AdHO-1 or AdGFP vectors. CD31 staining of the skin cross-section. Scale bar = 100 µm. C – Number of vessels in wounded skin in the db/db mice injected with AdHO-1 or AdGFP, on the 3rd and 14th days after wounding. Analysis of specimens stained for CD31 to visualize endothelial cells. Each bar represents mean+SD values for 5–8 animals. * P<0.05 in comparison to control, AdGFP injected animals.

Similar articles

Cited by

References

    1. Gurtner GC, Werner S, Barrandon Y, Longaker MT. Wound repair and regeneration. Nature. 2008;453:314–321. - PubMed
    1. Stadelmann WK, Digenis AG, Tobin GR. Physiology and healing dynamics of chronic cutaneous wounds. Am J Surg. 1998;176:26S–38S. - PubMed
    1. Falanga V. Wound healing and its impairment in the diabetic foot. Lancet. 2005;366:1736–1743. - PubMed
    1. Michaels J, Dobryansky M, Galiano RD, Bhatt KA, Ashinoff R, et al. Topical vascular endothelial growth factor reverses delayed wound healing secondary to angiogenesis inhibitor administration. Wound Repair Regen. 2005;13:506–512. - PubMed
    1. Bloch W, Huggel K, Sasaki T, Grose R, Bugnon P, et al. The angiogenesis inhibitor endostatin impairs blood vessel maturation during wound healing. Faseb J. 2000;14:2373–2376. - PubMed

Publication types