

Modelling HIV immune response and validation with clinical data
- PMID: 19495424
- PMCID: PMC2689816
- DOI: 10.1080/17513750701813184
Modelling HIV immune response and validation with clinical data
Abstract
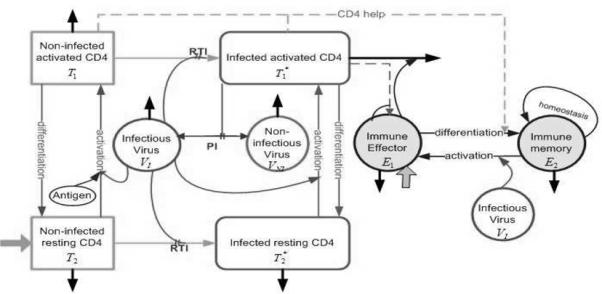
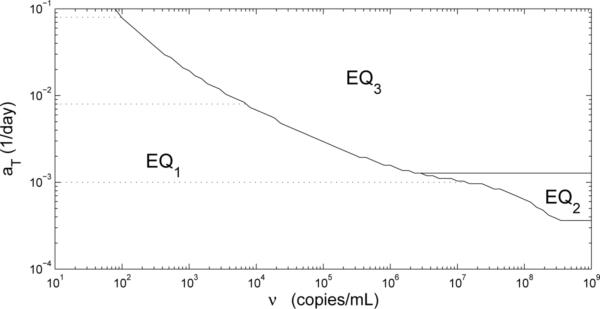
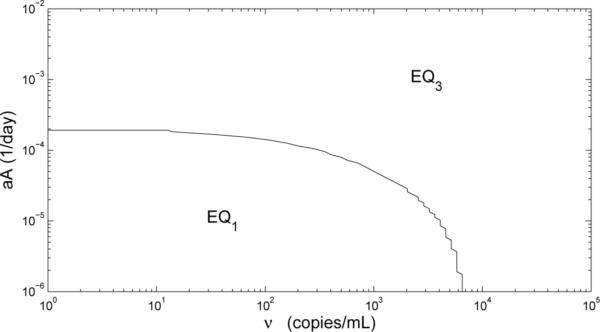
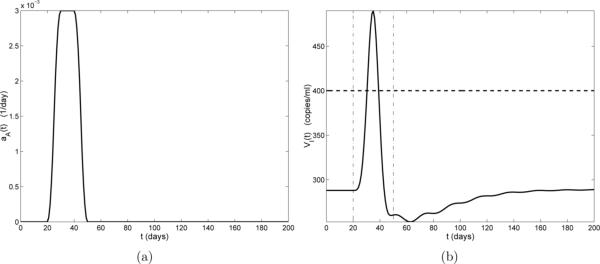
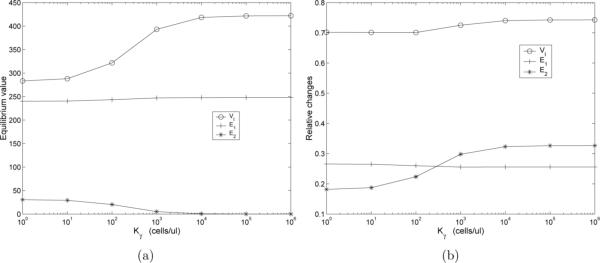
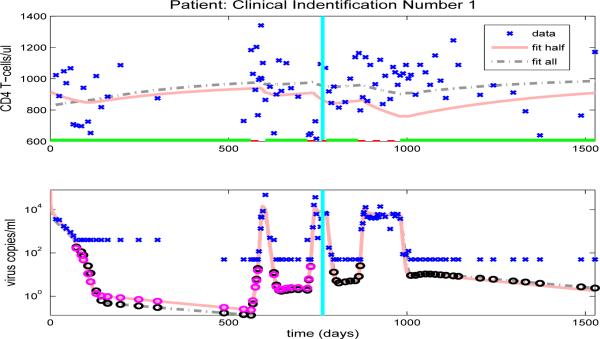
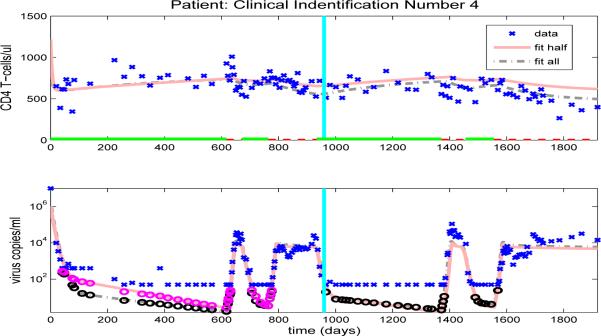
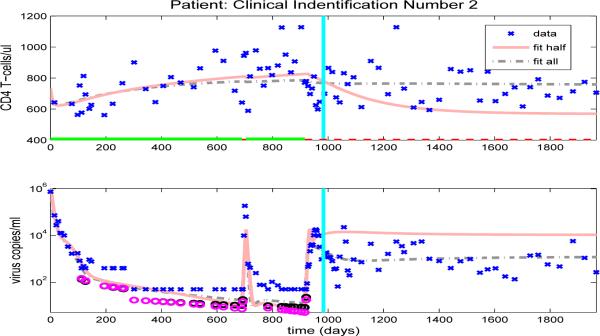
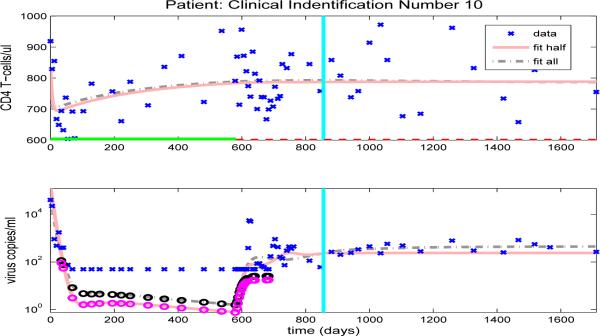
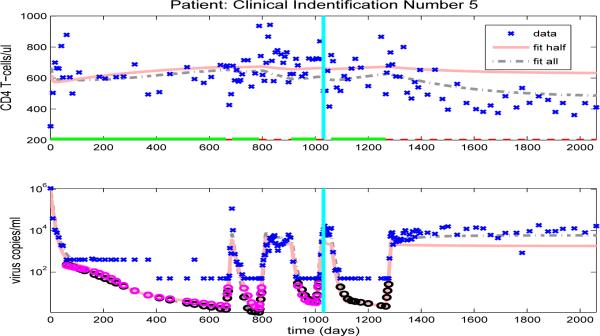
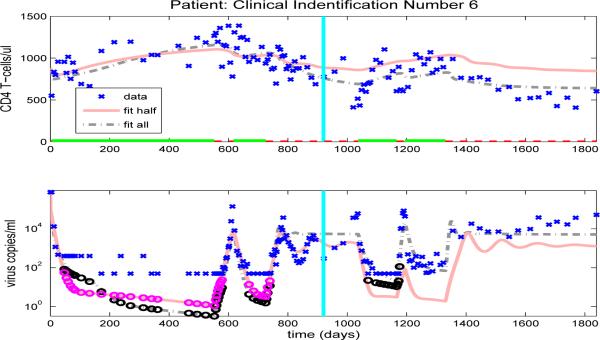
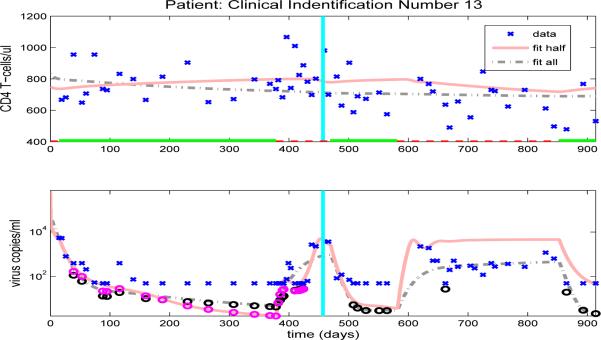
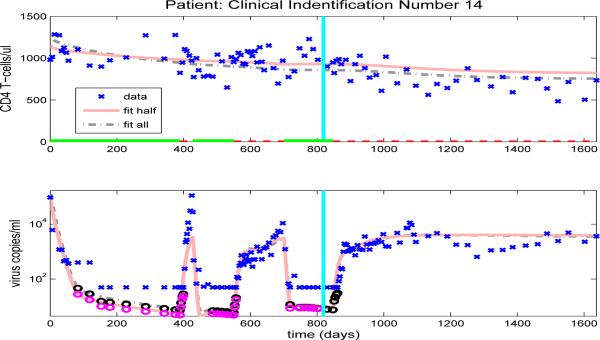
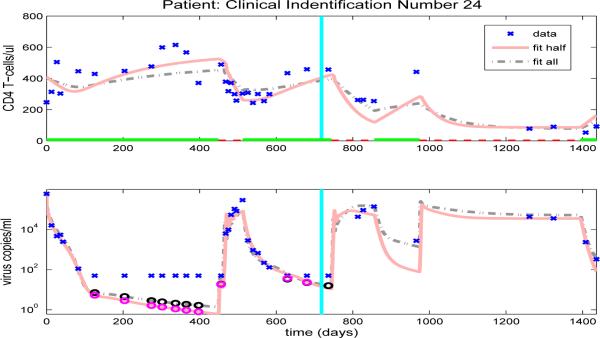
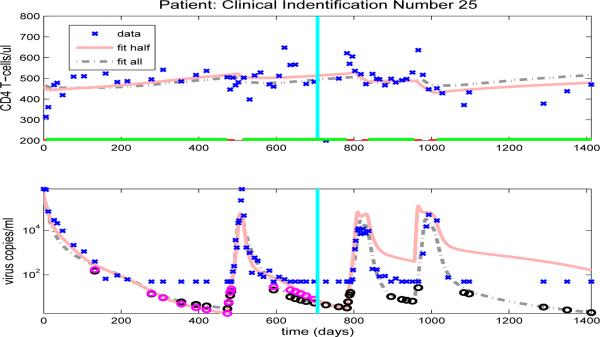
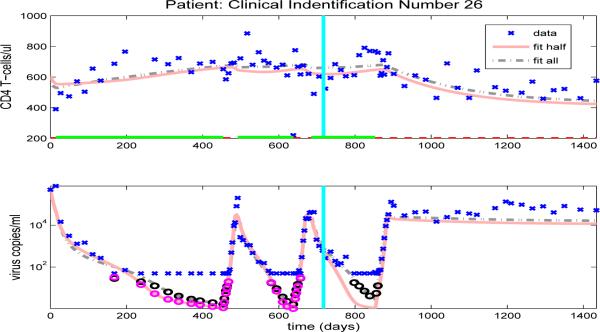
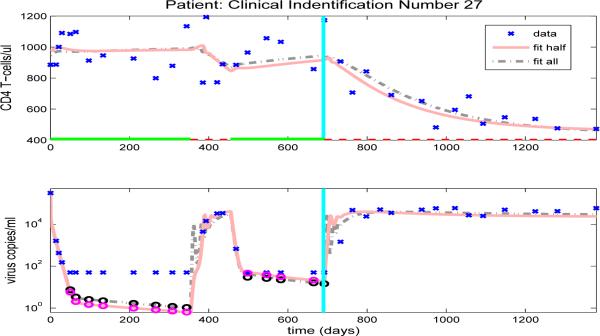
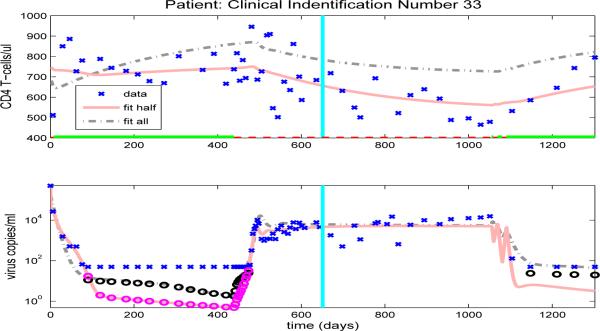
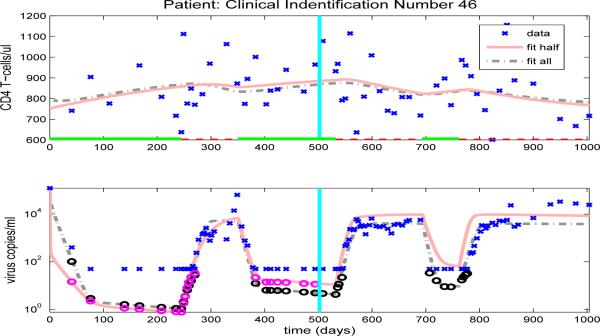
A system of ordinary differential equations is formulated to describe the pathogenesis of HIV infection, wherein certain features that have been shown to be important by recent experimental research are incorporated in the model. These include the role of CD4+ memory cells that serve as a major reservoir of latently infected cells, a critical role for T-helper cells in the generation of CD8 memory cells capable of efficient recall response, and stimulation by antigens other than HIV. A stability analysis illustrates the capability of this model in admitting multiple locally asymptotically stable (locally a.s.) off-treatment equilibria.We show that this more biologically detailed model can exhibit the phenomenon of transient viremia experienced by some patients on therapy with viral load levels suppressed below the detection limit. We also show that the loss of CD4+ T-cell help in the generation of CD8+ memory cells leads to larger peak values for the viral load during transient viremia. Censored clinical data is used to obtain parameter estimates. We demonstrate that using a reduced set of 16 free parameters, obtained by fixing some parameters at their population averages, the model provides reasonable fits to the patient data and, moreover, that it exhibits good predictive capability. We further show that parameter values obtained for most clinical patients do not admit multiple locally a.s off-treatment equilibria. This suggests that treatment to move from a high viral load equilibrium state to an equilibrium state with a lower (or zero) viral load is not possible for these patients.
Keywords: HIV; censored data; immune response; inverse problems; model prediction; multiple equilibria.
Figures
Similar articles
-
Establishment of a Novel Humanized Mouse Model To Investigate In Vivo Activation and Depletion of Patient-Derived HIV Latent Reservoirs.J Virol. 2019 Mar 5;93(6):e02051-18. doi: 10.1128/JVI.02051-18. Print 2019 Mar 15. J Virol. 2019. PMID: 30626677 Free PMC article.
-
HIV-specific CD4+ T cells and viremia: who's in control?Trends Immunol. 2006 Mar;27(3):119-24. doi: 10.1016/j.it.2006.01.004. Epub 2006 Feb 3. Trends Immunol. 2006. PMID: 16458605
-
Induction of Gag-specific CD4 T cell responses during acute HIV infection is associated with improved viral control.J Virol. 2014 Jul;88(13):7357-66. doi: 10.1128/JVI.00728-14. Epub 2014 Apr 16. J Virol. 2014. PMID: 24741089 Free PMC article.
-
Harnessing CD8+ T Cells Under HIV Antiretroviral Therapy.Front Immunol. 2019 Feb 26;10:291. doi: 10.3389/fimmu.2019.00291. eCollection 2019. Front Immunol. 2019. PMID: 30863403 Free PMC article. Review.
-
T cell immunity in acute HIV-1 infection.J Infect Dis. 2010 Oct 15;202 Suppl 2(Suppl 2):S302-8. doi: 10.1086/655652. J Infect Dis. 2010. PMID: 20846037 Free PMC article. Review.
Cited by
-
Experimental Design for Vector Output Systems.Inverse Probl Sci Eng. 2014 Jan 1;22(4):557-590. doi: 10.1080/17415977.2013.797973. Inverse Probl Sci Eng. 2014. PMID: 24563655 Free PMC article.
-
Model Comparison Tests to Determine Data Information Content.Appl Math Lett. 2015 Jan 1;43:10-18. doi: 10.1016/j.aml.2014.11.002. Appl Math Lett. 2015. PMID: 25574073 Free PMC article.
-
Designing a Predictive Model for Antiretroviral Regimen at the Antiretroviral Therapy Center in Chiro Hospital, Ethiopia.J Healthc Eng. 2021 Oct 29;2021:1161923. doi: 10.1155/2021/1161923. eCollection 2021. J Healthc Eng. 2021. PMID: 34745487 Free PMC article.
-
Information content in data sets for a nucleated-polymerization model.J Biol Dyn. 2015;9(1):172-97. doi: 10.1080/17513758.2015.1050465. Epub 2015 Jun 5. J Biol Dyn. 2015. PMID: 26046598 Free PMC article.
-
Multi-scale immunoepidemiological modeling of within-host and between-host HIV dynamics: systematic review of mathematical models.PeerJ. 2017 Sep 28;5:e3877. doi: 10.7717/peerj.3877. eCollection 2017. PeerJ. 2017. PMID: 28970973 Free PMC article.
References
-
- Adams BM, Banks HT, Davidian M, Kwon H, Tran HT, Wynne SN, Rosenberg ES. HIV dynamics: modeling, data analysis, and optimal treatment protocols. J. Computational and Applied Mathematics. 2005;184:10–49.
-
- Adams BM, Banks HT, Tran HT, Kwon H. Dynamic multidrug therapies for HIV: optimal and STI control approaches. Mathematical Biosciences and Engineering. 2004;1:223–241. - PubMed
-
- Adams BM, Banks HT, Davidian M, Rosenberg ES. Model fitting and prediction with HIV treatment interruption data. Bulletin of Mathematical Biology. 2007;69:563–584. CRSC-TR05−40, NCSU, October, 2005. - PubMed
-
- Altfeld M, Rosenberg ES. The role of CD4 T helper cells in the cytotoxic T lymphocyte response to HIV-1. Current Opinion in Immunology. 2000;12:375–380. - PubMed
-
- Bai P, Banks HT, Dediu S, Govan AY, Last M, Loyd A, Nguyen HK, Olufsen MS, Rempala G, Slenning BD. Stochastic and deterministic models for agricultural production networks. Mathematical Biosciences and Engineering. 2007;4:373–402. CRSC-TR07−06, NCSU, February, 2007. - PubMed
Publication types
MeSH terms
Substances
Grants and funding
LinkOut - more resources
Full Text Sources
Medical
Research Materials