. 2009 Mar 6:11:296-315.
doi: 10.1007/s12575-009-9000-5.

Streptozotocin, type I diabetes severity and bone

Affiliations

Streptozotocin, type I diabetes severity and bone

Katherine Motyl et al. Biol Proced Online. .

Abstract

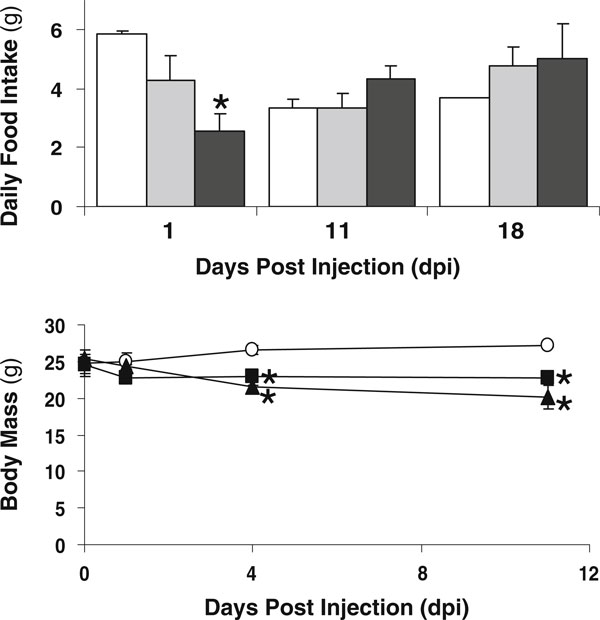
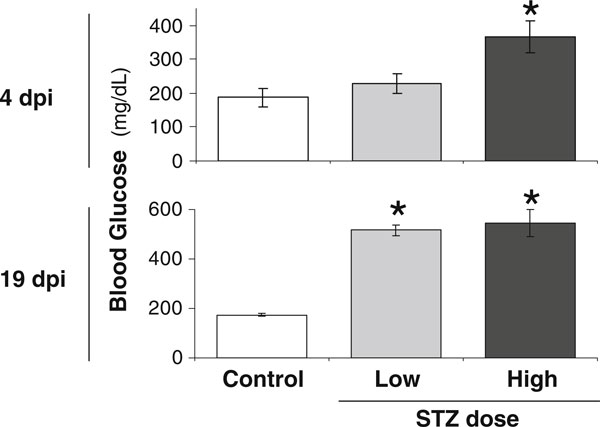
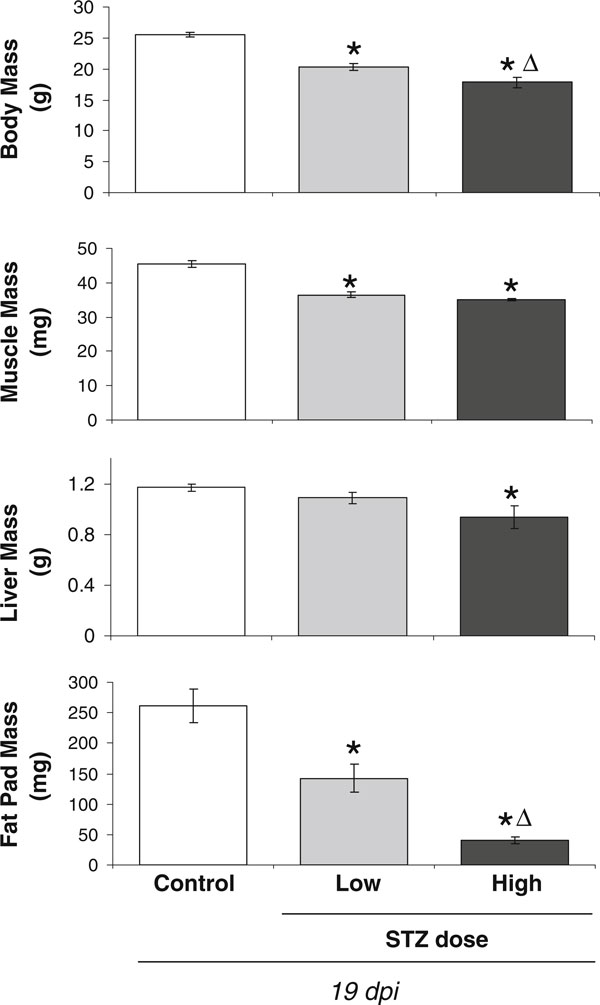
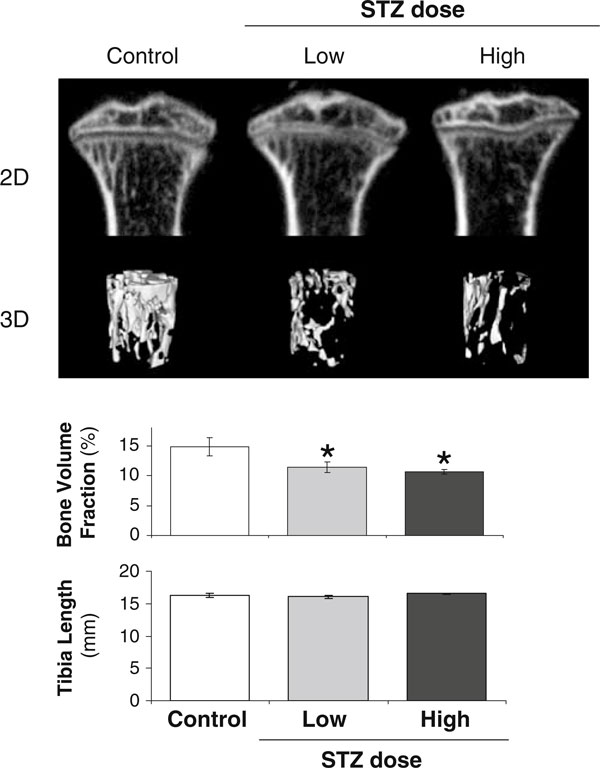
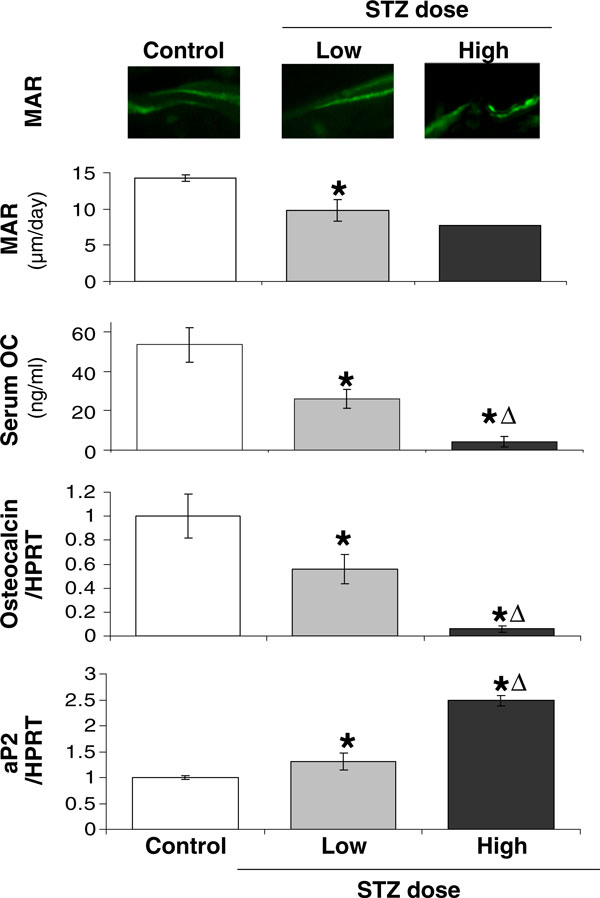
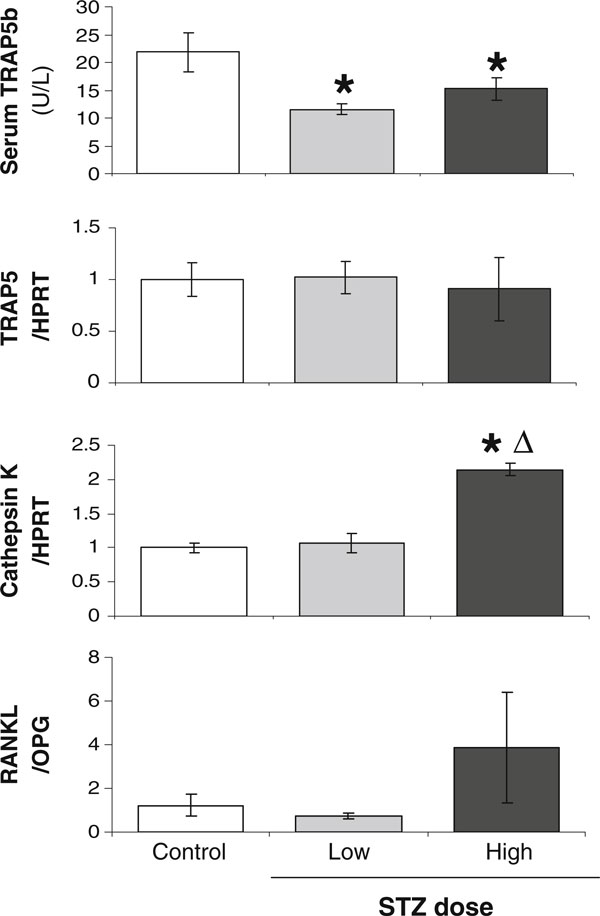
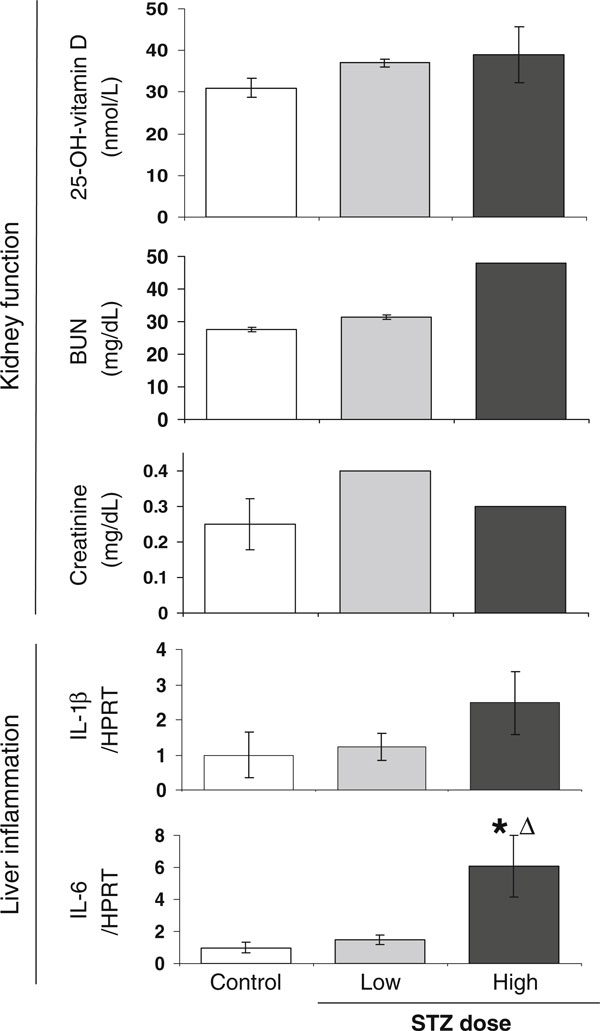
As many as 50% of adults with type I (T1) diabetes exhibit bone loss and are at increased risk for fractures. Therapeutic development to prevent bone loss and/or restore lost bone in T1 diabetic patients requires knowledge of the molecular mechanisms accounting for the bone pathology. Because cell culture models alone cannot fully address the systemic/metabolic complexity of T1 diabetes, animal models are critical. A variety of models exist including spontaneous and pharmacologically induced T1 diabetic rodents. In this paper, we discuss the streptozotocin (STZ)-induced T1 diabetic mouse model and examine dose-dependent effects on disease severity and bone. Five daily injections of either 40 or 60 mg/kg STZ induce bone pathologies similar to spontaneously diabetic mouse and rat models and to human T1 diabetic bone pathology. Specifically, bone volume, mineral apposition rate, and osteocalcin serum and tibia messenger RNA levels are decreased. In contrast, bone marrow adiposity and aP2 expression are increased with either dose. However, high-dose STZ caused a more rapid elevation of blood glucose levels and a greater magnitude of change in body mass, fat pad mass, and bone gene expression (osteocalcin, aP2). An increase in cathepsin K and in the ratio of RANKL/OPG was noted in high-dose STZ mice, suggesting the possibility that severe diabetes could increase osteoclast activity, something not seen with lower doses. This may contribute to some of the disparity between existing studies regarding the role of osteoclasts in diabetic bone pathology. Examination of kidney and liver toxicity indicate that the high STZ dose causes some liver inflammation. In summary, the multiple low-dose STZ mouse model exhibits a similar bone phenotype to spontaneous models, has low toxicity, and serves as a useful tool for examining mechanisms of T1 diabetic bone loss.


Figures

Figure 1
Figure 1
Mice exhibit decreased food intake following the first STZ injection and lose weight despite becoming hyperphagic at later time points. Top panel, Twenty-four-hour food intake (monitored throughout the experiment) is shown at 1, 11, and 18 days post-injection (dpi) for control (white bar), 40 mg/kg STZ (low dose, gray bar), or 60 mg/kg STZ mice (high dose, black bar). Only intake at 1 dpi was significantly decreased. Bottom panel, Mouse body mass was examined throughout the experiment for control (white circles), 40 mg/kg STZ (black square), or 60 mg/kg STZ mice (black triangle). All values represent averages ± SE. n > 3 per condition; *p < 0.05 compared to control.
Figure 2
Figure 2
High-dose STZ treatment causes a greater increase in blood glucose levels at early but not late time points compared to low dose STZ. Shown are mouse blood glucose levels measured at 4 and 19 days post-injection (dpi) for control (white bar), 40 mg/kg STZ (low dose, gray bar), or 60 mg/kg STZ mice (high dose, black bar). Values represent the average ± SE. n > 3 per condition. *p < 0.05 compared to control.
Figure 3
Figure 3
Body, muscle and fat pad mass decreases with both low and high dose STZ treatment. Body, muscle (tibialis anterior), liver, and fat pad (subcutaneous femoral fat) weights were measured at 19 dpi for control (white bar), 40 mg/kg STZ (low dose, gray bar), or 60 mg/kg STZ mice (high dose, black bar). Values represent the average ± SE. n > 3 per condition. *p < 0.05 compared to control; Δp < 0.05 compared to 40-mg/kg STZ dose.
Figure 4
Figure 4
Bone loss is evident in diabetes induced by both low- and high-dose STZ. The two-dimensional images at the top were obtained from micro-computed tomography analyses of representative tibias from control and STZ-treated mice (40 days post first injection). Three dimensional images were composed of 760 consecutive slices. The bar graphs indicate the measured bone volume fraction (average ± SE) of the tibial trabecular region and the tibia lengths of control (white bar), 40 mg/kg STZ (low dose, gray bar), or 60 mg/kg STZ mice (high dose, black bar). n > 3 per condition. *p < 0.05 compared to control.
Figure 5
Figure 5
STZ-induced T1-diabetes decreases MAR, serum osteocalcin, and bone osteocalcin mRNA while increasing aP2 expression. Control (white bar), 40 mg/kg STZ (low dose, gray bar), and 60 mg/kg STZ mice (high dose, black bar) were examined at 19 dpi for osteoblast parameters: mineral apposition rate (MAR; representative fluorescent images of calcein labeling of bone shown at top of figure), serum osteocalcin (OC), and tibial osteocalcin mRNA levels [expressed relative to hypoxanthine–guanine phosphoribosyl transferase (HPRT), a housekeeping gene). Expression of a mature adipocyte marker, aP2, was also examined. For all RNA analyses, expression was expressed relative to control levels which were set to 1. Values represent the average ± SE. n > 3 per condition, except for high STZ dose MAR (n = 1). *p < 0.05 compared to control; Δp < 0.05 compared to 40-mg/kg STZ dose.
Figure 6
Figure 6
T1-diabetes decreases serum TRAP5b, while high-dose STZ increases cathepsin K and RANKL/OPG ratio. Control (white bar), 40 mg/kg STZ (low dose, gray bar), and 60 mg/kg STZ mice (high dose, black bar) were examined at 19 dpi for osteoclast markers and activity: serum TRAP5b, TRAP5 RNA, cathepsin K RNA, and RANKL/OPG RNA ratio. RNA levels were expressed relative to HPRT. RNA values represent the average ± SE and are expressed relative to control mice (set to 1). *p < 0.05 compared to control. Δp < 0.05 compared to 40-mg/kg STZ dose.
Figure 7
Figure 7
Both low and high STZ dose does not influence kidney function, but high dose is associated with liver inflammation. Control (white bar), 40 mg/kg STZ (low dose, gray bar), and 60 mg/kg STZ mice (high dose, black bar) were examined at 19 dpi for markers of kidney function (25-OH vitamin D, BUN, and creatinine serum levels) and liver toxicity (IL-1β and IL-6 RNA levels). For serum analyses, samples were pooled to meet the quantities necessary for measurement. For 25-hydroxyvitamin D: three samples were analyzed per condition (each sample contained serum pooled from one to four individual mice). BUN and creatinine analyses were done on one (high dose) or two (control and low dose) blood samples, each containing serum pooled from five individual mice. IL-6 and C/EBPβ RNA levels were expressed relative to HPRT. Serum values represent mean ± SD. RNA values represent the average ± SE and are expressed relative to control mice (set to 1). *p < 0.05 compared to control; Δp < 0.05 compared to 40-mg/kg STZ dose.

References

    1. Bouillon R. et al.Influence of age, sex, and insulin on osteoblast function: osteoblast dysfunction in diabetes mellitus. J Clin Endocrinol Metab. 1995;80(4):1194–202. doi: 10.1210/jc.80.4.1194. - DOI - PubMed
    1. Kemink SA. et al.Osteopenia in insulin-dependent diabetes mellitus; prevalence and aspects of pathophysiology. J Endocrinol Invest. 2000;23(5):295–303. - PubMed
    1. Auwerx J. et al.Mineral metabolism and bone mass at peripheral and axial skeleton in diabetes mellitus. Diabetes. 1988;37(1):8–12. doi: 10.2337/diabetes.37.1.8. - DOI - PubMed
    1. Krakauer JC. et al.Bone loss and bone turnover in diabetes. Diabetes. 1995;44(7):775–82. doi: 10.2337/diabetes.44.7.775. - DOI - PubMed
    1. Levin ME, Boisseau VC, Avioli LV. Effects of diabetes mellitus on bone mass in juvenile and adult-onset diabetes. N Engl J Med. 1976;294(5):241–245. doi: 10.1056/NEJM197601292940502. - DOI - PubMed