. 2009 Aug 20;515(6):629-46.
doi: 10.1002/cne.22081.

Collateral projections of neurons in laminae I, III, and IV of rat spinal cord to thalamus, periaqueductal gray matter, and lateral parabrachial area

Affiliations
Free PMC article

Collateral projections of neurons in laminae I, III, and IV of rat spinal cord to thalamus, periaqueductal gray matter, and lateral parabrachial area

Khulood M Al-Khater et al. J Comp Neurol. .
Free PMC article

Abstract

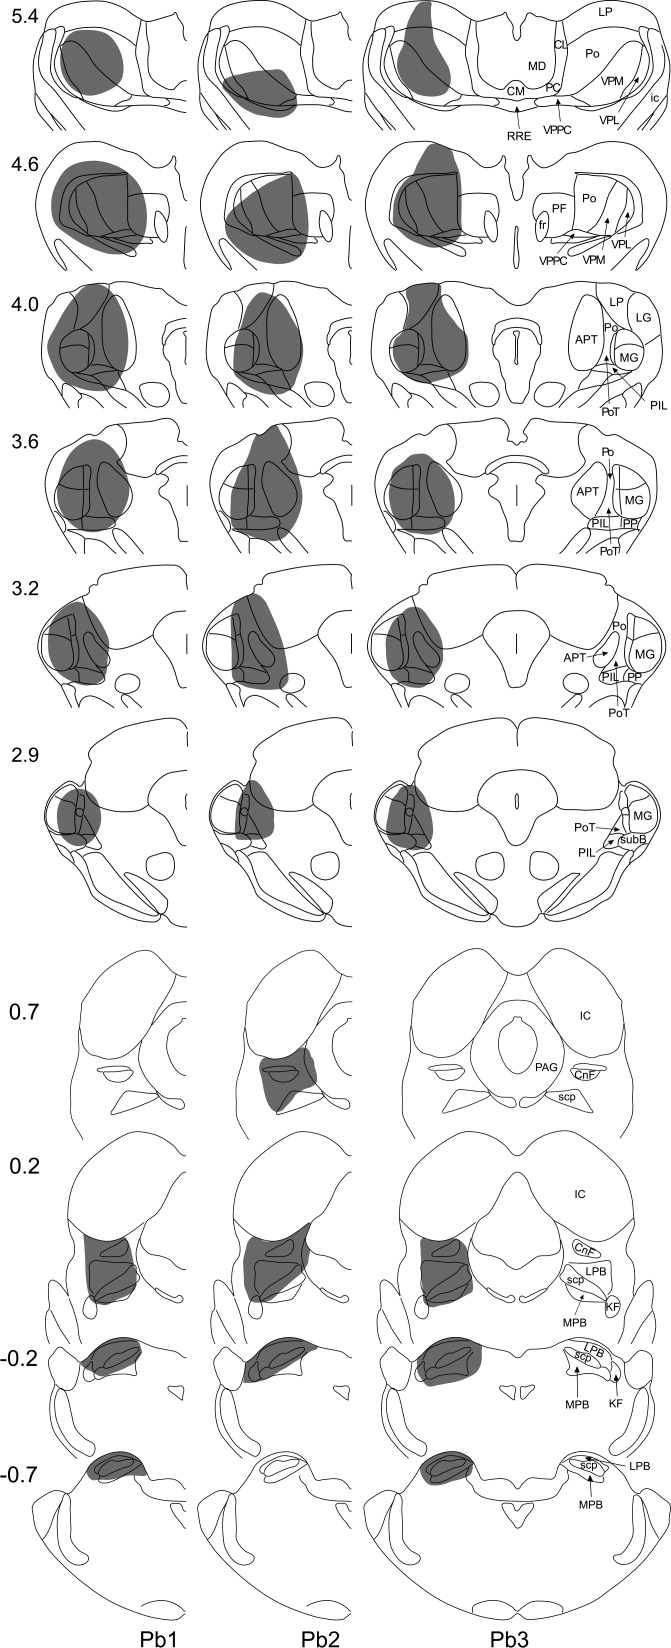
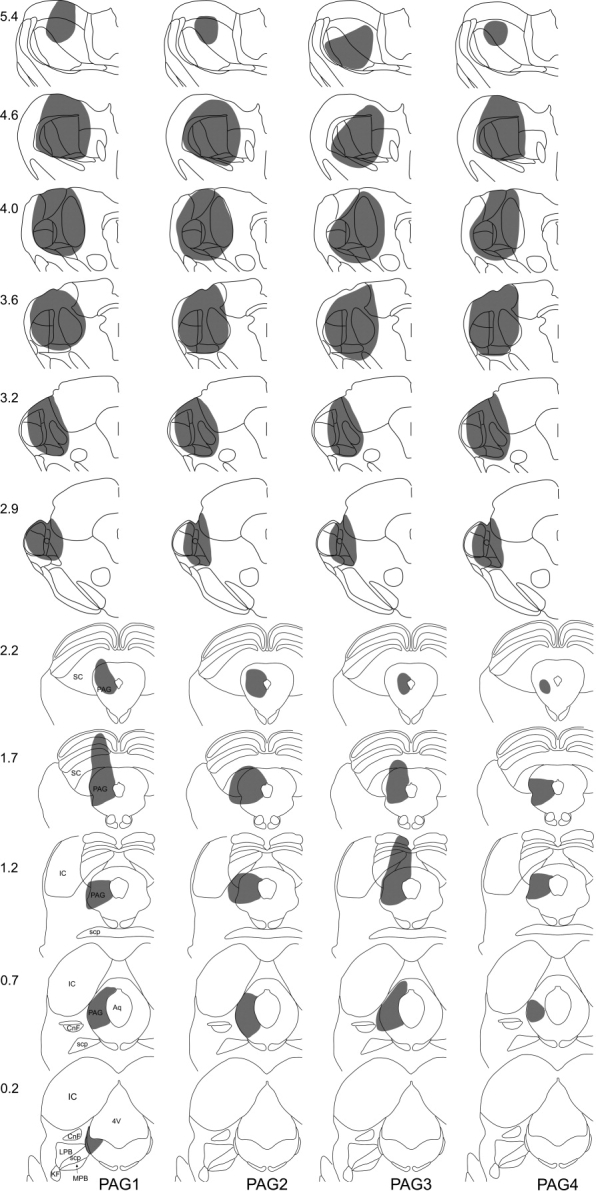
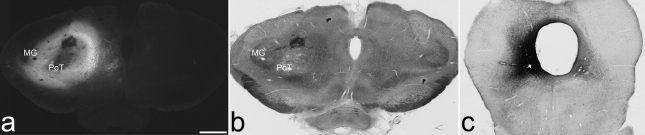
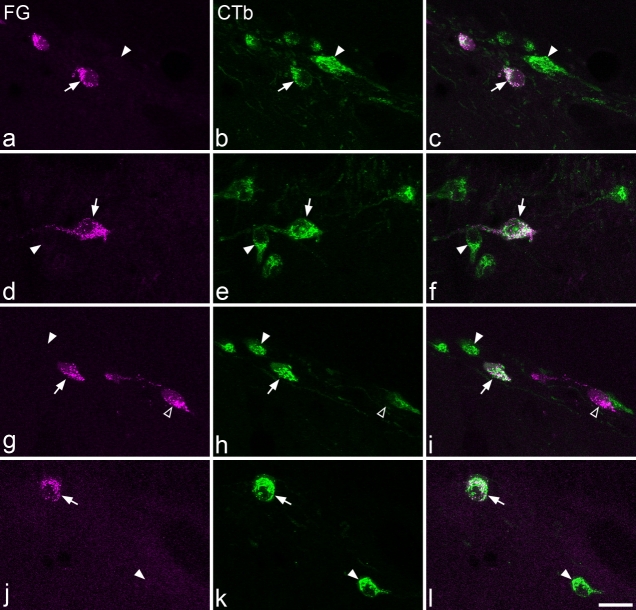
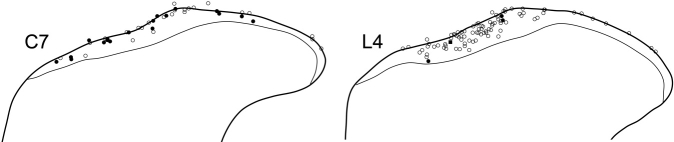
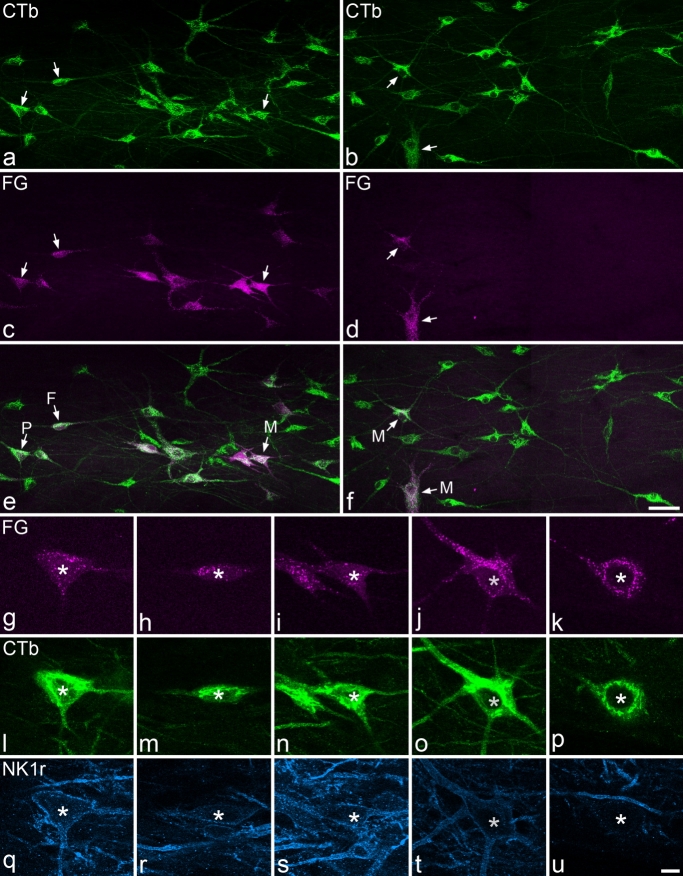
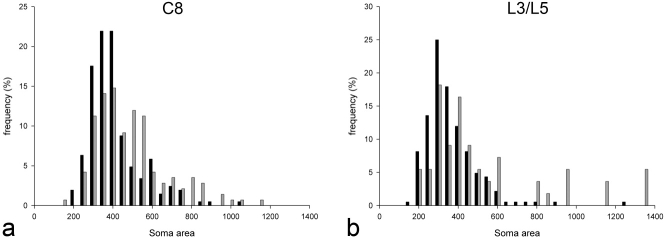
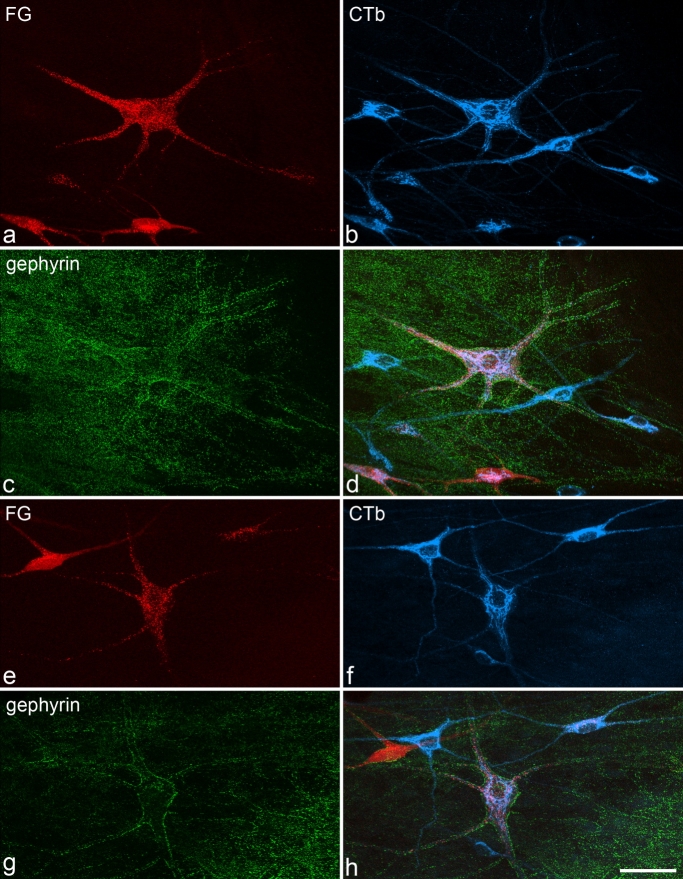
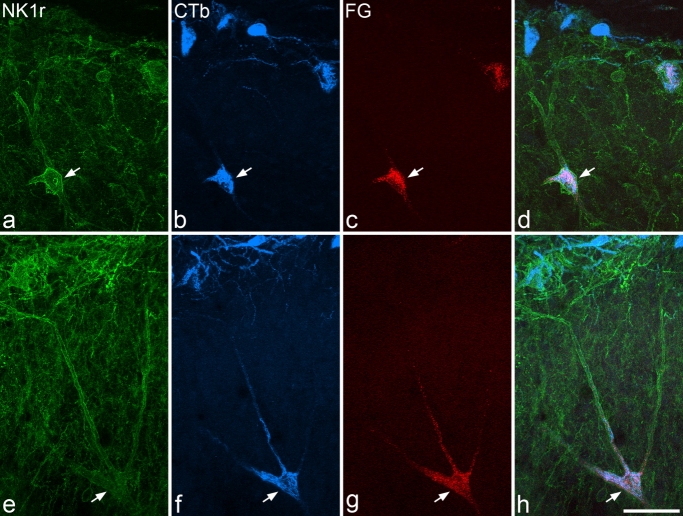
Projection neurons in lamina I, together with those in laminae III-IV that express the neurokinin 1 receptor (NK1r), form a major route through which nociceptive information reaches the brain. Axons of these cells innervate various targets, including thalamus, periaqueductal gray matter (PAG), and lateral parabrachial area (LPb), and many cells project to more than one target. The aims of this study were to quantify projections from cervical enlargement to PAG and LPb, to determine the proportion of spinothalamic neurons at lumbar and cervical levels that were labelled from PAG and LPb, and to investigate morphological differences between projection populations. The C7 segment contained fewer lamina I spinoparabrachial cells than L4, but a similar number of spino-PAG cells. Virtually all spinothalamic lamina I neurons at both levels were labelled from LPb and between one-third and one-half from PAG. This suggests that significant numbers project to all three targets. Spinothalamic lamina I neurons differed from those labelled only from LPb in that they were generally larger, were more often multipolar, and (in cervical enlargement) had stronger NK1r immunoreactivity. Most lamina III/IV NK1r cells at both levels projected to LPb, but few were labelled from PAG. The great majority of these cells in C7 and over one-fourth of those in L4 were spinothalamic, and at each level some projected to both thalamus and LPb. These results confirm that neurons in these laminae have extensive collateral projections and suggest that different neuronal subpopulations in lamina I have characteristic patterns of supraspinal projection.


Figures

Figure 1
Figure 1
Fluorogold and CTb injection sites in experiments Pb1–3. Drawings to show the spread of tracer (shaded area) in these experiments. Each vertical column represents a single experiment, and the experiment number is shown at the bottom of the column. Numbers to the left give the approximate position of the section relative to the interaural plane. Drawings are based on those in Paxinos and Watson (2005). The upper six outlines in each column represent the Fluorogold injection (targetted on caudal thalamus), while the lower four show the spread of CTb (targetted on LPb). APT, anterior pretectal nucleus; CL, centrolateral thalamic nucleus; CM, central medial thalamic nucleus; CnF, cuneiform nucleus; fr, fasciculus retroflexus; IC, inferior colliculus; ic, internal capsule; KF, Kölliker-Fuse nucleus; LG, lateral geniculate nucleus; LP, lateral posterior thalamic nucleus; LPB, lateral parabrachial nucleus; MD, mediodorsal thalamic nucleus; MG, medial geniculate nucleus; MPB, medial parabrachial nucleus; PAG, periaqueductal gray matter; PC, paracentral thalamic nucleus; PF, parafascicular thalamic nucleus; PIL, posterior intralaminar thalamic nucleus; Po, posterior thalamic nuclear group; PoT, posterior thalamic nuclear group, triangular part; PP, peripeduncular nucleus; RRE, retrouniens area; SC, superior colliculus; scp, superior cerebellar peduncle; SubB, subbrachial nucleus; VPL, ventral posterolateral thalamic nucleus; VPM, ventral posteromedial thalamic nucleus; VPPC, ventral posterior thalamic nucleus, parvicellular part.
Figure 2
Figure 2
Fluorogold and CTb injection sites in experiments PAG1–4. Drawings to show the spread of tracer (shaded area) in these experiments. Each vertical column represents a single experiment, and the experiment number is shown at the bottom of the column. Numbers to the left give the approximate position of the section anterior to the interaural plane. Drawings are based on those in Paxinos and Watson (2005). The upper six outlines in each column represent the Fluorogold injection (targetted on caudal thalamus), whereas the lower five show the spread of CTb (targetted on PAG). 4V, fourth ventricle; Aq, aqueduct; SC, superior colliculus. Other abbreviations as in Figure 1.
Figure 3
Figure 3
Examples of Fluorogold and CTb injection sites. a,b: Fluorescent and brightfield photomicrographs of a section (interaural ∼4 mm) through the thalamic injection site in PAG3. c: Section (interaural ∼0.9 mm) through the CTb injection in PAG4. The section was reacted with an immunoperoxidase method to reveal CTb. Scale bar = 1 mm.
Figure 4
Figure 4
Retrograde labelling of lamina I neurons in transverse sections. In all cases Fluorogold (FG; transported from thalamus) is shown in magenta, and CTb (transported from LPb or PAG) is green. Arrows indicate double-labelled cells, solid arrowheads indicate cells labelled only with CTb, and the open arrowhead shows a cell labelled only with Fluorogold. ac: Part of a section from C7 of experiment Pb1 contains several spinoparabrachial neurons, two of which are also labelled from the thalamus. df: Section from L4 of the same experiment shows spinoparabrachial neurons, one of which is labelled from thalamus. gi: This field from C7 of experiment PAG3 contains single-labelled spinothalamic and spino-PAG neurons as well as a cell labelled from both sites. jl: Section through L4 of the same experiment containing two spino-PAG cells, one of which is labelled from the thalamus. All images are obtained from 10 optical sections at 2-μm z-spacing. Scale bar = 20 μm.
Figure 5
Figure 5
Plots of the locations of spinothalamic and spinoparabrachial neurons at cervical and lumbar levels. These drawings show the locations of all retrogradely labelled lamina I neurons in 10 alternate 60-μm sections through the C7 segment of experiment Pb2 and the L4 segment of Pb3. Open circles indicate cells labelled only from the LPb, solid circles are double-labelled cells, and the square is a cell that was labelled only from thalamus. The lower line indicates the approximate border between laminae I and II. There are more spinoparabrachial cells and many fewer spinothalamic cells in L4 compared with C7. Note that these drawings show 10 sections through the L4 segment (to allow direct comparison with C7), although the quantitative analysis of spinothalamic cells in L4 in these experiments presented in Table 3 was performed on 20 sections.
Figure 6
Figure 6
Lamina I spinoparabrachial and spinothalamic neurons in horizontal sections. a,c,e: Part of a section through the C8 segment of experiment Pb1. a: CTb (transported from LPb) is shown in green. c: Fluorogold (FG, transported from thalamus) is magenta. e: Merged image. Several spinoparabrachial neurons (three of which are indicated with arrows) are visible, and some of these are also retrogradely labelled from the thalamus. These cells have various shapes: those labelled P, F, and M are of pyramidal, fusiform, and multipolar types, respectively. b,d,f: Part of a section through L3 from Pb1 (colors as in a,c,e). Several spinoparabrachial neurons are visible, and two of these (arrows) are labelled from the thalamus. Both of these cells are multipolar (M). gu: Higher magnification views through the five neurons marked with arrows in a–f, scanned to reveal Fluorogold (g–k), CTb (l–p), and NK1r (q–u). g,l,q: The pyramidal cell shows moderate (+++) NK1r immunoreactivity. h,m,r: The fusiform cell is very weakly immunoreactive (+) for NK1r. i,n,s: The multipolar cell was also classified as moderately (+++) NK1r-immunoreactive. j,o,t: The upper marked multipolar cell seen in f shows weak (++) NK1r immunostaining. k,p,u: The lower multipolar cell in f was classified as nonimmunoreactive (–) for NK1r. a,c,e and b,d,f are projections of 20 and 26 optical sections at 2-μm z-spacing, respectively. g–u are each projections of two optical sections at 1-μm z-spacing. Scale bars = 50 μm in f (applies to a–f); 10 μm in u (applies to g–u).
Figure 7
Figure 7
Soma areas of spinothalamic and other spinoparabrachial lamina I neurons. a: Histogram showing the distribution of cross-sectional areas of lamina I neurons labelled from the thalamus (gray bars) and of neurons that were labelled from LPb but not thalamus (black bars) in the C8 segment. b: Histogram showing the equivalent data for the lumbar enlargement. In this case, the sizes of spinothalamic neurons in both L3 and L5 segments are included (gray bars), whereas the sizes of neurons labelled from LPb but not thalamus (black bars) are from the L3 segment only.
Figure 8
Figure 8
Large gephyrin-coated lamina I cells retrogradely labelled from thalamus, LPb, and PAG. Images from confocal scans through horizontal sections of C6 that show Fluorogold (FG; transported from thalamus, red), CTb (transported from LPb or PAG, blue), and gephyrin (green). ad: This field from experiment Pb2 shows a large gephyrin-coated cell (center) that is retrogradely labelled from both thalamus and LPb. Several other CTb-labelled (spinoparabrachial) cells are also visible, and some of these also contain Fluorogold. eh: Part of a section from experiment PAG4 shows a large gephyrin-coated cell (center) that is retrogradely labelled from thalamus and PAG. Other cells that are labelled from one or both of these regions are also visible. Images are projected from 24 (a–d) and 12 (e–h) optical sections at 2-μm z-spacing. Scale bar = 50 μm.
Figure 9
Figure 9
Retrograde labelling of lamina III/IV NK1r-immunoreactive neurons. These images are from confocal scans that show immunoreactivity for NK1r (green), CTb (transported from LPb, blue), and Fluorogold (FG; transported from thalamus, red) in transverse sections through C7 (ad) and L4 (eh) from experiment Pb3. In each case, a single large NK1r-immunoreactive cell with its soma in lamina III or IV is labelled with both retrograde tracers (arrows). Images are projections of 20 (a–d) or 18 (e–h) confocal optical sections at 2-μm z-spacing. Scale bar = 50 μm.

References

    1. Al-Khater KM, Kerr R, Todd AJ. A quantitative study of spinothalamic neurons in laminae I, III, and IV in lumbar and cervical segments of the rat spinal cord. J Comp Neurol. 2008;511:1–18. - PMC - PubMed
    1. Almarestani L, Waters SM, Krause JE, Bennett GJ, Ribeiro-da-Silva A. Morphological characterization of spinal cord dorsal horn lamina I neurons projecting to the parabrachial nucleus in the rat. J Comp Neurol. 2007;504:287–297. - PubMed
    1. Basbaum AI. Conduction of the effects of noxious stimulation by short-fiber multisynaptic systems of the spinal cord in the rat. Exp Neurol. 1973;40:699–716. - PubMed
    1. Becker CM, Hoch W, Betz H. Sensitive immunoassay shows selective association of peripheral and integral membrane proteins of the inhibitory glycine receptor complex. J Neurochem. 1989;53:124–131. - PubMed
    1. Beitz AJ. The organization of afferent projections to the midbrain periaqueductal gray of the rat. Neuroscience. 1982;7:133–159. - PubMed

Publication types