Quantitative morphometry of electrophysiologically identified CA3b interneurons reveals robust local geometry and distinct cell classes
- PMID: 19496174
- PMCID: PMC2827149
- DOI: 10.1002/cne.22082
Quantitative morphometry of electrophysiologically identified CA3b interneurons reveals robust local geometry and distinct cell classes
Abstract
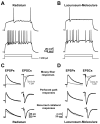
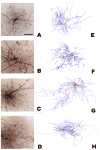
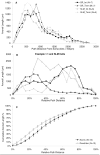
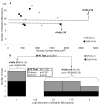
The morphological and electrophysiological diversity of inhibitory cells in hippocampal area CA3 may underlie specific computational roles and is not yet fully elucidated. In particular, interneurons with somata in strata radiatum (R) and lacunosum-moleculare (L-M) receive converging stimulation from the dentate gyrus and entorhinal cortex as well as within CA3. Although these cells express different forms of synaptic plasticity, their axonal trees and connectivity are still largely unknown. We investigated the branching and spatial patterns, plus the membrane and synaptic properties, of rat CA3b R and L-M interneurons digitally reconstructed after intracellular labeling. We found considerable variability within but no difference between the two layers, and no correlation between morphological and biophysical properties. Nevertheless, two cell types were identified based on the number of dendritic bifurcations, with significantly different anatomical and electrophysiological features. Axons generally branched an order of magnitude more than dendrites. However, interneurons on both sides of the R/L-M boundary revealed surprisingly modular axodendritic arborizations with consistently uniform local branch geometry. Both axons and dendrites followed a lamellar organization, and axons displayed a spatial preference toward the fissure. Moreover, only a small fraction of the axonal arbor extended to the outer portion of the invaded volume, and tended to return toward the proximal region. In contrast, dendritic trees demonstrated more limited but isotropic volume occupancy. These results suggest a role of predominantly local feedforward and lateral inhibitory control for both R and L-M interneurons. Such a role may be essential to balance the extensive recurrent excitation of area CA3 underlying hippocampal autoassociative memory function.
. (c) 2009 Wiley-Liss, Inc.
Figures





Similar articles
-
Membrane properties and synaptic responses of interneurons located near the stratum lacunosum-moleculare/radiatum border of area CA1 in whole-cell recordings from rat hippocampal slices.J Neurophysiol. 1994 Jun;71(6):2217-35. doi: 10.1152/jn.1994.71.6.2217. J Neurophysiol. 1994. PMID: 7931512
-
Unitary IPSPs evoked by interneurons at the stratum radiatum-stratum lacunosum-moleculare border in the CA1 area of the rat hippocampus in vitro.J Physiol. 1998 Feb 1;506 ( Pt 3)(Pt 3):755-73. doi: 10.1111/j.1469-7793.1998.755bv.x. J Physiol. 1998. PMID: 9503336 Free PMC article.
-
Ultrastructure of stratum lacunosum-moleculare interneurons of hippocampal CA1 region.Synapse. 1988;2(4):382-94. doi: 10.1002/syn.890020405. Synapse. 1988. PMID: 3187908
-
A hippocampal interneuron associated with the mossy fiber system.Proc Natl Acad Sci U S A. 2000 Feb 1;97(3):1275-80. doi: 10.1073/pnas.97.3.1275. Proc Natl Acad Sci U S A. 2000. PMID: 10655521 Free PMC article.
-
Cholecystokinin-immunopositive basket and Schaffer collateral-associated interneurones target different domains of pyramidal cells in the CA1 area of the rat hippocampus.Neuroscience. 2002;109(1):63-80. doi: 10.1016/s0306-4522(01)00440-7. Neuroscience. 2002. PMID: 11784700
Cited by
-
Cajal-Retzius cells and GABAergic interneurons of the developing hippocampus: Close electrophysiological encounters of the third kind.Brain Res. 2018 Oct 15;1697:124-133. doi: 10.1016/j.brainres.2018.07.028. Epub 2018 Jul 30. Brain Res. 2018. PMID: 30071194 Free PMC article. Review.
-
Potential Synaptic Connectivity of Different Neurons onto Pyramidal Cells in a 3D Reconstruction of the Rat Hippocampus.Front Neuroinform. 2011 Jul 4;5:5. doi: 10.3389/fninf.2011.00005. eCollection 2011. Front Neuroinform. 2011. PMID: 21779242 Free PMC article.
-
High affinity group III mGluRs regulate mossy fiber input to CA3 interneurons.Hippocampus. 2011 Dec;21(12):1302-17. doi: 10.1002/hipo.20842. Epub 2010 Sep 7. Hippocampus. 2011. PMID: 20824730 Free PMC article.
-
Formation and retrieval of cell assemblies in a biologically realistic spiking neural network model of area CA3 in the mouse hippocampus.J Comput Neurosci. 2024 Nov;52(4):303-321. doi: 10.1007/s10827-024-00881-3. Epub 2024 Sep 17. J Comput Neurosci. 2024. PMID: 39285088 Free PMC article.
-
Pattern separation in the dentate gyrus: a role for the CA3 backprojection.Hippocampus. 2011 Nov;21(11):1190-215. doi: 10.1002/hipo.20828. Epub 2010 Aug 3. Hippocampus. 2011. PMID: 20683841 Free PMC article.
References
-
- Amaral DG, Witter MP. The three-dimensional organization of the hippocampal formation: a review of anatomical data. Neuroscience. 1989;31:571–91. - PubMed
-
- Andersen P, Soleng AF, Raastad M. The hippocampal lamella hypothesis revisited. Brain Res. 2000;886:165–171. - PubMed
-
- Ascoli GA. Mobilizing the base of neuroscience data: the case of neuronal morphologies. Nat Rev Neurosci. 2006;7:318–24. - PubMed
Publication types
MeSH terms
Substances
Grants and funding
LinkOut - more resources
Full Text Sources
Miscellaneous

