

Density-dependent intraspecific competition in the larval stage of Aedes aegypti (Diptera: Culicidae): revisiting the current paradigm
- PMID: 19496407
- PMCID: PMC2702140
- DOI: 10.1603/033.046.0301
Density-dependent intraspecific competition in the larval stage of Aedes aegypti (Diptera: Culicidae): revisiting the current paradigm
Abstract
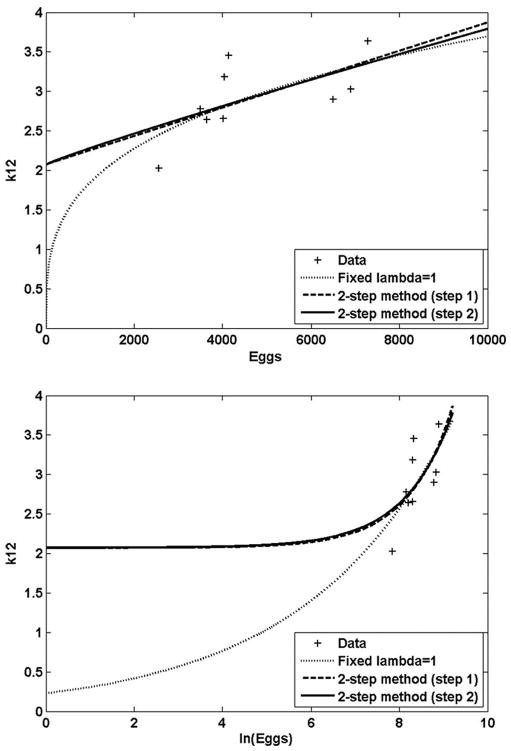
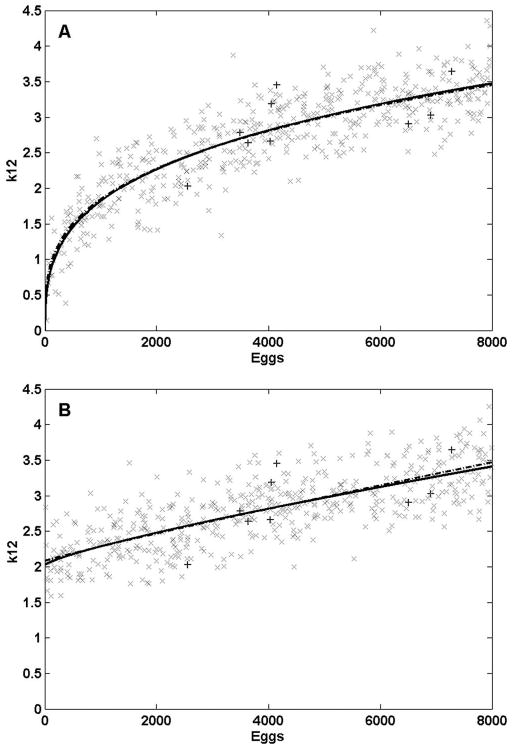
Density-dependent intraspecific competition has been considered an important determinant of the dynamics of larval stages of Aedes aegypti. A model was published in 1984 providing a mathematical description of this density dependence, based on field data, that has since been widely used. This description, however, is based on the strong assumption that all mortality is density-dependent. We re-examine the data without this premise and find a reduced importance of density dependence, as well as a different functional form. Based on these discrepancies, we emphasize that the characterization of density dependence in the larval stages of Ae. aegypti should be based on a more complete dataset, and we use artificially generated data to explore how such additional information could help developing a better description of this density dependence. We review other empirical studies on larval competition, discuss the need for further dedicated studies, and provide a few simple guidelines for the design of such studies.
Figures
Similar articles
-
Effects of intraspecific larval competition on adult longevity in the mosquitoes Aedes aegypti and Aedes albopictus.Med Vet Entomol. 2009 Mar;23(1):62-8. doi: 10.1111/j.1365-2915.2008.00782.x. Med Vet Entomol. 2009. PMID: 19239615 Free PMC article.
-
Clash of mosquito wings: Larval interspecific competition among the mosquitoes, Culex pipiens, Aedes albopictus and Aedes aegypti reveals complex population dynamics in shared habitats.Med Vet Entomol. 2024 Dec;38(4):462-471. doi: 10.1111/mve.12742. Epub 2024 Jul 9. Med Vet Entomol. 2024. PMID: 38980066
-
Container Size Alters the Outcome of Interspecific Competition Between Aedes aegypti (Diptera: Culicidae) and Aedes albopictus.J Med Entomol. 2019 Apr 16;56(3):708-715. doi: 10.1093/jme/tjy215. J Med Entomol. 2019. PMID: 30566608
-
The Importance of Interspecific Interactions on the Present Range of the Invasive Mosquito Aedes albopictus (Diptera: Culicidae) and Persistence of Resident Container Species in the United States.J Med Entomol. 2016 Sep;53(5):992-1001. doi: 10.1093/jme/tjw095. Epub 2016 Jun 28. J Med Entomol. 2016. PMID: 27354436 Review.
-
What Can Larval Ecology Tell Us About the Success of Aedes albopictus (Diptera: Culicidae) Within the United States?J Med Entomol. 2016 Sep;53(5):1002-12. doi: 10.1093/jme/tjw046. Epub 2016 Jun 28. J Med Entomol. 2016. PMID: 27354437 Review.
Cited by
-
Neurobiology and Changing Ecosystems: Mechanisms Underlying Responses to Human-Generated Environmental Impacts.J Neurosci. 2023 Nov 8;43(45):7530-7537. doi: 10.1523/JNEUROSCI.1431-23.2023. J Neurosci. 2023. PMID: 37940589 Free PMC article.
-
Effects of inbreeding and genetic modification on Aedes aegypti larval competition and adult energy reserves.Parasit Vectors. 2010 Oct 6;3:92. doi: 10.1186/1756-3305-3-92. Parasit Vectors. 2010. PMID: 20925917 Free PMC article.
-
Quantifying the Influence of Larval Density on Disease Transmission Indices in Culex quinquefasciatus, the Major African Vector of Filariasis.Int J Insect Sci. 2019 Jun 19;11:1179543319856022. doi: 10.1177/1179543319856022. eCollection 2019. Int J Insect Sci. 2019. PMID: 31258336 Free PMC article.
-
Different demographic responses of three species of container Aedes (Diptera: Culicidae) larvae to timing of extrinsic mortality.J Med Entomol. 2024 Jan 12;61(1):121-131. doi: 10.1093/jme/tjad129. J Med Entomol. 2024. PMID: 37742046 Free PMC article.
-
Species-specific non-physical interference competition among mosquito larvae.PLoS One. 2014 Feb 18;9(2):e88650. doi: 10.1371/journal.pone.0088650. eCollection 2014. PLoS One. 2014. PMID: 24558406 Free PMC article.
References
-
- Agnew P, Hide M, Sidobre C, Michalakis Y. A minimalistic approach to the effects of density-dependent competition on insect life-history traits. Ecol Entomol. 2002;27:396–402.
-
- Agudelo-Silva F, Spielman A. Paradoxical effects of simulated larviciding on production of adult mosquitoes. Am J Trop Med Hyg. 1984;33:1267–1269. - PubMed
-
- Arrivillaga J, Barrera R. Food as a limiting factor for A. aegypti in water-storage containers. J Vector Ecol. 2004;29:11–20. - PubMed
-
- Barrera R, Amador M, Clark GG. Ecological factors influencing Aedes aegypti (Diptera: Culicidae) productivity in artificial containers in Salinas, Puerto Rico. J Med Entomol. 2006;43:484–492. - PubMed
Publication types
MeSH terms
Grants and funding
LinkOut - more resources
Full Text Sources
