

Development of the calcium plateau following status epilepticus: role of calcium in epileptogenesis
- PMID: 19496685
- PMCID: PMC3476463
- DOI: 10.1586/ern.09.21
Development of the calcium plateau following status epilepticus: role of calcium in epileptogenesis
Abstract
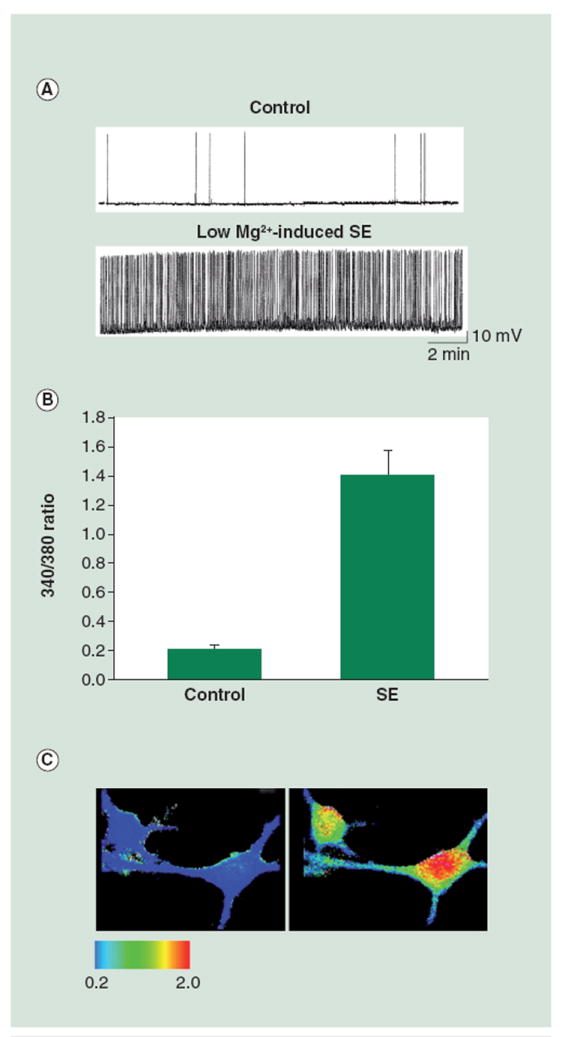
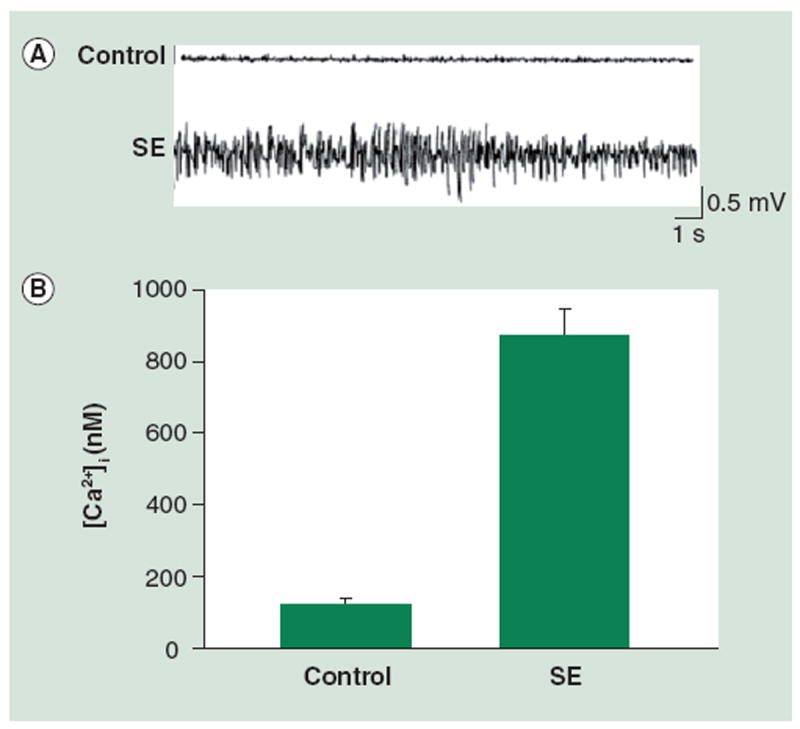
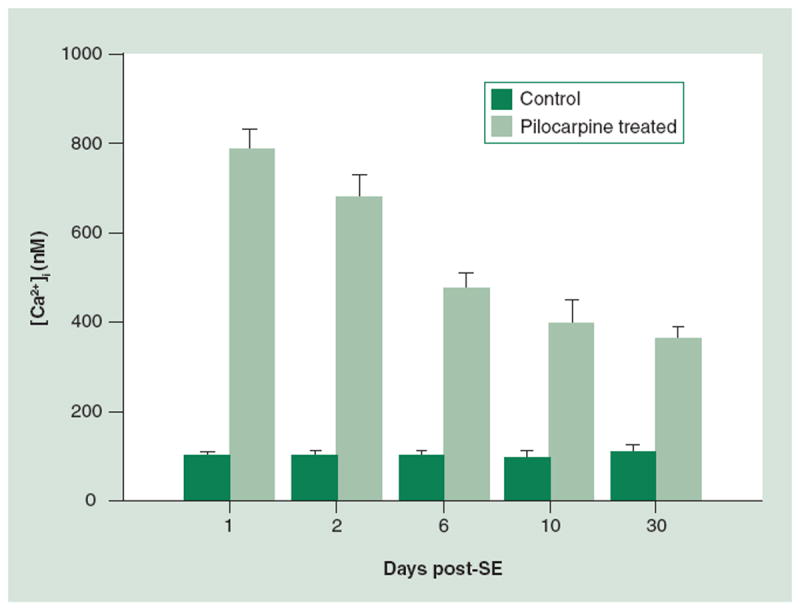
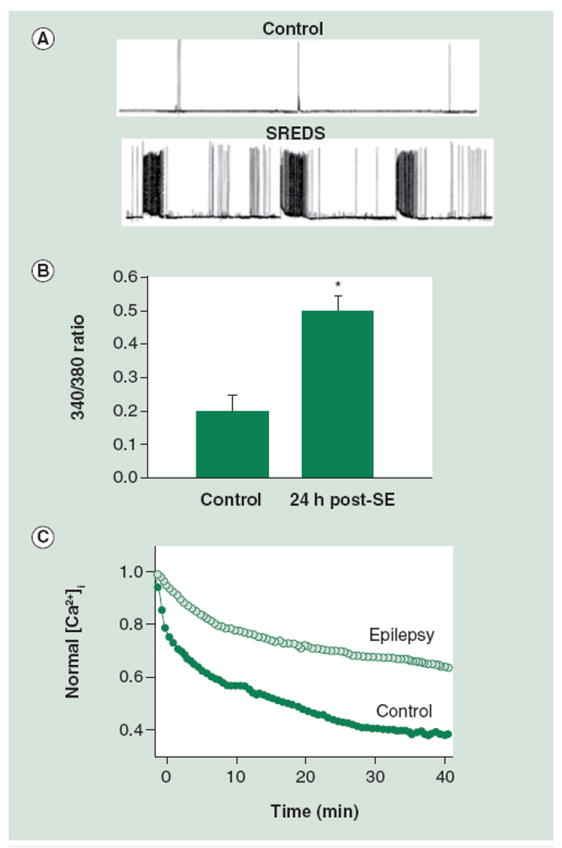
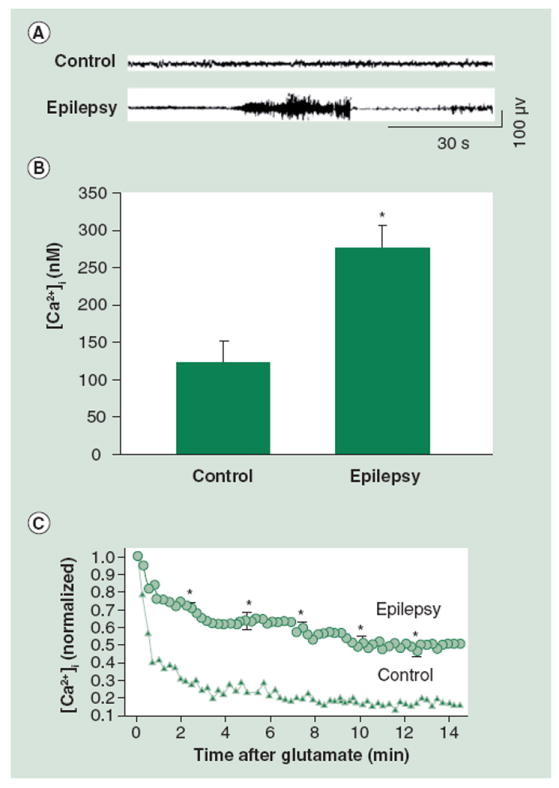
Status epilepticus is a clinical emergency defined as continuous seizure activity or rapid, recurrent seizures without regaining consciousness and can lead to the development of acquired epilepsy, characterized by spontaneous, recurrent seizures. Understanding epileptogenesis--the transformation of healthy brain tissue into hyperexcitable neuronal networks--is an important challenge and the elucidation of molecular mechanisms can lend insight into new therapeutic targets to halt this progression. It has been demonstrated that intracellular calcium increases during status epilepticus and that these elevations are maintained past the duration of the injury (Ca(2+) plateau). As an important second messenger, Ca(2+) elevations can lead to changes in gene expression, neurotransmitter release and plasticity. Thus, characterization of the post-injury Ca(2+) plateau may be important in eventually understanding the pathophysiology of epileptogenesis and preventing the progression to chronic epilepsy after brain injury.
Conflict of interest statement
The authors have no other relevant affiliations or financial involvement with any organization or entity with a financial interest in or financial conflict with the subject matter or materials discussed in the manuscript apart from those disclosed.
No writing assistance was utilized in the production of this manuscript.
Figures
Similar articles
-
Dantrolene inhibits the calcium plateau and prevents the development of spontaneous recurrent epileptiform discharges following in vitro status epilepticus.Eur J Neurosci. 2010 Jul;32(1):80-8. doi: 10.1111/j.1460-9568.2010.07262.x. Epub 2010 Jun 28. Eur J Neurosci. 2010. PMID: 20597971 Free PMC article.
-
Calcium Channel Subunit α2δ4 Is Regulated by Early Growth Response 1 and Facilitates Epileptogenesis.J Neurosci. 2019 Apr 24;39(17):3175-3187. doi: 10.1523/JNEUROSCI.1731-18.2019. Epub 2019 Feb 21. J Neurosci. 2019. PMID: 30792272 Free PMC article.
-
In vivo measurement of brain network connectivity reflects progression and intrinsic disease severity in a model of temporal lobe epilepsy.Neurobiol Dis. 2019 Jul;127:45-52. doi: 10.1016/j.nbd.2019.02.012. Epub 2019 Feb 21. Neurobiol Dis. 2019. PMID: 30798008
-
The course of cellular alterations associated with the development of spontaneous seizures after status epilepticus.Prog Brain Res. 2002;135:53-65. doi: 10.1016/S0079-6123(02)35007-6. Prog Brain Res. 2002. PMID: 12143370 Review.
-
Epileptogenesis in neonatal brain.Semin Fetal Neonatal Med. 2018 Jun;23(3):159-167. doi: 10.1016/j.siny.2017.12.004. Epub 2017 Dec 23. Semin Fetal Neonatal Med. 2018. PMID: 29467100 Free PMC article. Review.
Cited by
-
Targeting Intracellular Calcium Stores Alleviates Neurological Morbidities in a DFP-Based Rat Model of Gulf War Illness.Toxicol Sci. 2019 Jun 1;169(2):567-578. doi: 10.1093/toxsci/kfz070. Toxicol Sci. 2019. PMID: 30859209 Free PMC article.
-
Mitochondrial calcium homeostasis as potential target for mitochondrial medicine.Mitochondrion. 2012 Jan;12(1):77-85. doi: 10.1016/j.mito.2011.07.004. Epub 2011 Jul 21. Mitochondrion. 2012. PMID: 21798374 Free PMC article. Review.
-
Overexpression of KCNN4 channels in principal neurons produces an anti-seizure effect without reducing their coding ability.Gene Ther. 2024 Mar;31(3-4):144-153. doi: 10.1038/s41434-023-00427-9. Epub 2023 Nov 15. Gene Ther. 2024. PMID: 37968509
-
Pathophysiology of Status Epilepticus Revisited.Int J Mol Sci. 2025 Aug 3;26(15):7502. doi: 10.3390/ijms26157502. Int J Mol Sci. 2025. PMID: 40806628 Free PMC article. Review.
-
[Research progress on the effects of plateau hypoxia on blood-brain barrier structure and drug permeability].Zhejiang Da Xue Xue Bao Yi Xue Ban. 2019 Dec 25;48(6):668-673. doi: 10.3785/j.issn.1008-9292.2019.12.12. Zhejiang Da Xue Xue Bao Yi Xue Ban. 2019. PMID: 31955542 Free PMC article. Review. Chinese.
References
-
- Willmore LJ. Post-traumatic epilepsy: cellular mechanisms and implications for treatment. Epilepsia. 1990;31(Suppl. 3):S67–S73. - PubMed
-
- Cavalheiro EA, Leite JP, Bortolotto ZA, et al. Long-term effects of pilocarpine in rats: structural damage of the brain triggers kindling and spontaneous recurrent seizures. Epilepsia. 1991;32(6):778–782. - PubMed
-
- Lothman EW, Bertram EH., 3rd Epileptogenic effects of status epilepticus. Epilepsia. 1993;34(Suppl. 1):S59–S70. - PubMed
-
- Hesdorffer DC, Logroscino G, Cascino G, Annegers JF, Hauser WA. Risk of unprovoked seizure after acute symptomatic seizure: effect of status epilepticus. Ann Neurol. 1998;44(6):908–912. - PubMed
Website
-
- Internet Stroke Center at Washington Univ. in St. Louis. The Stroke Trials Registry. www.strokecenter.org/trials/InterventionDetail.aspx?tid=95.
Publication types
MeSH terms
Substances
Grants and funding
LinkOut - more resources
Full Text Sources
Research Materials
Miscellaneous