. 2009 Oct;11(10):1492-501.
doi: 10.1111/j.1462-5822.2009.01342.x. Epub 2009 Jun 3.

Plasmodium berghei-infection induces volume-regulated anion channel-like activity in human hepatoma cells

Affiliations
Free PMC article

Plasmodium berghei-infection induces volume-regulated anion channel-like activity in human hepatoma cells

Miguel Prudêncio et al. Cell Microbiol. 2009 Oct.
Free PMC article

Abstract

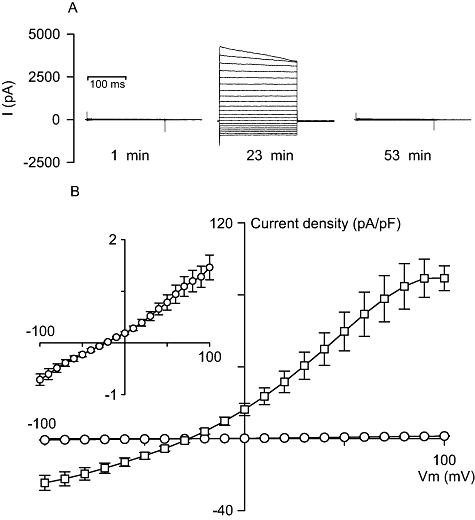
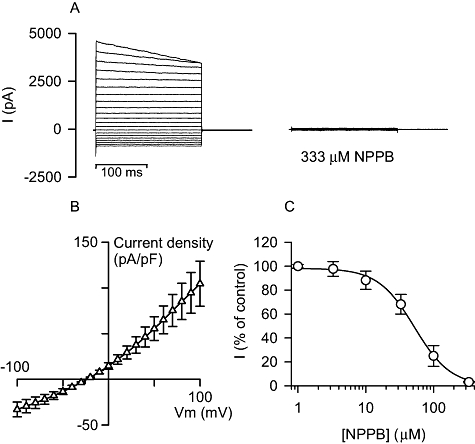
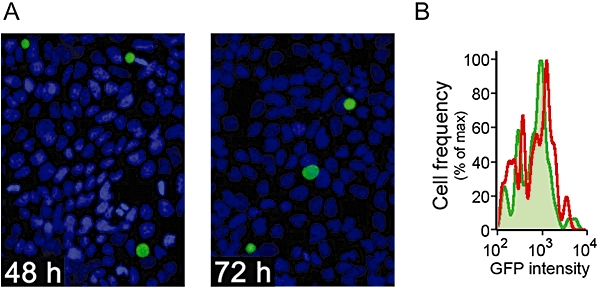
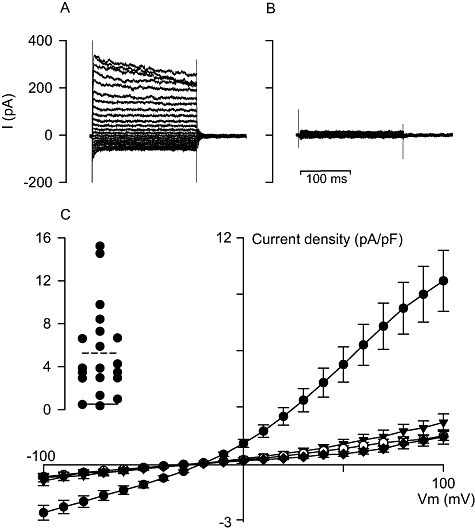
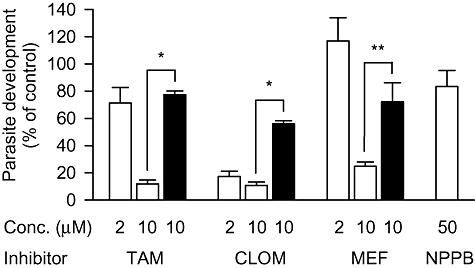
Parasite infection can lead to alterations in the permeability of host plasma membranes. Presented here is the first demonstration that this phenomenon occurs in Plasmodium-infected liver cells. Using the whole-cell patch-clamp technique, volume-regulated anion channel (VRAC) activity was characterized in Huh-7 cells (a human hepatoma cell line) before and after infection with Plasmodium berghei. Consistent with the presence of VRACs, hypotonic bath solution induced large ion currents in Huh-7 cells that rectified outwardly, reversed close to the equilibrium potential for Cl(-) and were inhibited by tamoxifen, clomiphene, mefloquine and 5-nitro-2, 3-(phenylpropylamino)-benzoic acid (NPPB), with IC(50) values of 4 +/- 1, 4 +/- 2, 2 +/- 1 and 52 +/- 12 microM respectively. In isotonic conditions, initial current recordings measured in uninfected and immature (24 h post invasion) parasite-infected Huh-7 cells were similar (with conductances of 14 +/- 3 versus 19 +/- 5 pS/pF). However, in mature (48-72 h post invasion) parasite-infected Huh-7 cells there was a sevenfold increase in currents (with a conductance of 98 +/- 16 pS/pF). The elevated currents observed in the latter are consistent with VRAC-like activity and the possible reasons for their activation are discussed.


Figures

Fig. 1
Fig. 1
Whole-cell current recordings in uninfected Huh-7 cells under isotonic conditions. A. Representative set of current recordings in isotonic conditions, holding potential = −30 mV, which demonstrates the development and subsequent decline of currents in a proportion of uninfected Huh-7 cells. Note: times shown in the figure represent the times after whole-cell rupture. B. Current density/voltage curves for averaged late current data (measured between 140 and 200 ms) from recordings taken directly after attaining the whole-cell configuration (open circles; n = 30) and from recordings taken at peak current levels in a proportion of Huh-7 cells in which current levels increased spontaneously during experimentation (open squares; n = 5). Inset, expanded view of data generated in Huh-7 cells directly after attaining the whole-cell configuration. Late current data are shown as the mean ± SEM.
Fig. 2
Fig. 2
Whole-cell current recordings in uninfected Huh-7 cells under hypotonic conditions. A. Representative set of current recordings in hypotonic conditions, holding potential = −30 mV, showing the peak currents obtained in a Huh-7 cell and the subsequent effect of the addition to the bath solution of 333 μM NPPB. B. Current density/voltage curve for averaged late current data (measured between 140 and 200 ms) from recordings taken at peak current levels in Huh-7 cells exposed to hypotonic bath solution (open triangles; n = 7). Late current data are shown as the mean ± SEM. C. Dose–response curve for the effect of NPPB on the hypotonically activated currents in Huh-7 cells, measure at a membrane potential of +20 mV (open circles; n = 3). Inhibition data are shown as the mean ± SEM.
Fig. 3
Fig. 3
The development of live-stage P. berghei parasites in Huh-7 cells. A. Representative immunofluorescence microscopy images of parasitized cells at 48 h (left panel) and 72 h (right panel) post invasion. Plasmodium liver stages are stained in green and nuclei in blue. B. Development profile of GFP-expressing P. berghei parasites by flow cytometry analysis of infected cells 48 h (green line and shading) and 72 h (red line) post invasion.
Fig. 4
Fig. 4
Whole-cell current recordings in P. berghei-infected Huh-7 cells under isotonic conditions. A. Representative current recording in a parasitized Huh-7 cell 48–72 h post invasion, holding potential = −30 mV, taken directly after attaining the whole-cell configuration. B. Representative current recording in a parasitized Huh-7 cell 48–72 h post invasion, holding potential = −30 mV, taken directly after attaining the whole-cell configuration following a 5 min pre-incubation with 333 μM NPPB. C. Current density/voltage curves for averaged late current data (measured between 140 and 200 ms) from recordings taken directly after attaining the whole-cell configuration in uninfected Huh-7 cells (open circles; n = 30), parasitized Huh-7 cells 24 h post invasion (closed inverted triangles; n = 7), parasitized Huh-7 cells 48–72 h post invasion (closed circles; n = 20) and parasitized Huh-7 cells 48–72 h post invasion pre-incubated (5 min) with 333 μM NPPB (closed diamonds; n = 4). Late current data are shown as the mean ± SEM. Inset. Individual currents measured at +50 mV for the 20 parasitized Huh-7 cells 48–72 h post invasion (solid line, mean current in uninfected Huh-7 cells; dashed line, mean current in parasitized Huh-7 cells 48–72 h post invasion).
Fig. 5
Fig. 5
Effect of current inhibitors on the development of P. berghei parasites in Huh-7 cells. Effect of current inhibitors added to Huh-7 cells 1 h before invasion (open bars) and 24 h post invasion (closed bars) on parasite development measured at 48 h post invasion. Mean (geometric) GFP intensity was used to estimate parasite development and is presented as a percentage of the GFP intensity measured in paired control experiments performed in the absence of any inhibitors. To calculate development data measured over the 24–48 h period, the GFP intensity of parasitized Huh-7 cells measured at 24 h post invasion (approximately 15% of that measured at 48 h post invasion in control experiments) was first subtracted from each data set, including the control data. Uncorrected geometrical mean (and range) GFP-intensities for infected cells (n = 3) measured at 2 (background), 24 and 48 h post invasion were 26 (25–27), 79 (46–160) and 340 (159–651) respectively. TAM, tamoxifen; CLOM, clomiphene; MEF, mefloquine; NPPB, 5-nitro-2, 3-(phenylpropylamino)-benzoic acid. *P < 0.005 and **P < 0.05 (two-tailed, unpaired Student's t-test on log-transformed data).

Similar articles

Cited by

References

    1. Bodily K, Wang Y, Roman R, Sostman A, Fitz JG. Characterization of a swelling-activated anion conductance in homozygous typing cell hepatoma cells. Hepatology. 1997;25:403–410. - PubMed
    1. Boulard Y, Landau I, Miltgen F, Peters W, Ellis DS. The chemotherapy of rodent malaria XLI. Causal prophylaxis. Part V. Effect of mefloquine on exoerythrocytic schizogony in Plasmodium yoelii yoelii. Ann Trop Med Parasitol. 1986;80:577–580. - PubMed
    1. Cunha-Rodrigues M, Prudencio M, Mota MM, Haas W. Antimalarial drugs – host targets (re)visited. Biotechnol J. 2006;1:321–332. - PubMed
    1. Decherf G, Egee S, Staines HM, Ellory JC, Thomas SL. Anionic channels in malaria-infected human red blood cells. Blood Cells Mol Dis. 2004;32:366–371. - PubMed
    1. van Dijk MR, Douradinha B, Franke-Fayard B, Heussler V, van Dooren MW, van Schaijk B, et al. Genetically attenuated, P36p-deficient malarial sporozoites induce protective immunity and apoptosis of infected liver cells. Proc Natl Acad Sci USA. 2005;102:12194–12199. - PMC - PubMed

Publication types

LinkOut - more resources