. 2009 Jun 23;106(25):10302-7.
doi: 10.1073/pnas.0901831106. Epub 2009 Jun 3.

Key role of coupling, delay, and noise in resting brain fluctuations

Affiliations

Key role of coupling, delay, and noise in resting brain fluctuations

Gustavo Deco et al. Proc Natl Acad Sci U S A. .

Erratum in

  • Proc Natl Acad Sci U S A. 2009 Jul 21;106(29):12207-8

Abstract

A growing body of neuroimaging research has documented that, in the absence of an explicit task, the brain shows temporally coherent activity. This so-called "resting state" activity or, more explicitly, the default-mode network, has been associated with daydreaming, free association, stream of consciousness, or inner rehearsal in humans, but similar patterns have also been found under anesthesia and in monkeys. Spatiotemporal activity patterns in the default-mode network are both complex and consistent, which raises the question whether they are the expression of an interesting cognitive architecture or the consequence of intrinsic network constraints. In numerical simulation, we studied the dynamics of a simplified cortical network using 38 noise-driven (Wilson-Cowan) oscillators, which in isolation remain just below their oscillatory threshold. Time delay coupling based on lengths and strengths of primate corticocortical pathways leads to the emergence of 2 sets of 40-Hz oscillators. The sets showed synchronization that was anticorrelated at <0.1 Hz across the sets in line with a wide range of recent experimental observations. Systematic variation of conduction velocity, coupling strength, and noise level indicate a high sensitivity of emerging synchrony as well as simulated blood flow blood oxygen level-dependent (BOLD) on the underlying parameter values. Optimal sensitivity was observed around conduction velocities of 1-2 m/s, with very weak coupling between oscillators. An additional finding was that the optimal noise level had a characteristic scale, indicating the presence of stochastic resonance, which allows the network dynamics to respond with high sensitivity to changes in diffuse feedback activity.


Conflict of interest statement

The authors declare no conflict of interest.

Figures
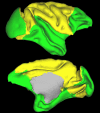
Fig. 1.
Fig. 1.
Anatomical plot of the 2 extracted communities. Shown is a plot of the macaque cortical surface in Caret coordinates (36) with the 2 main clusters indicated in the connection matrix labeled in green and yellow. The green cluster consists mostly of visual areas (with the exception of V2) as well as prefrontal areas. The yellow cluster consists mainly of sensorimotor and premotor areas.
Fig. 2.
Fig. 2.
Parameter analysis of the collective brain network dynamics. The parameters studied are the global coupling α (ordinate) and the delays expressed by the internode communication velocity v (abscissa). The color code is the Kuramoto synchronization index. The black asterisk indicates the chosen working point between the 2 synchronization bumps corresponding to elevated synchronization in one or the other extracted community. The warm colors represent synchronization in the occipital–temporal–prefrontal community, and cold colors represent synchronization in the sensorimotor–premotor community.
Fig. 3.
Fig. 3.
Synchronization analysis of simulated neuroelectric activity. (Left) Level of synchronization for each of the 2 individual communities as measured by the Kuramoto order parameter (community 1, black; community 2, red; difference, blue). (Right) Power spectrum of the signal given by differences between the level of synchronization between both communities. (A) The results obtained by selecting the optimal working point P (see Fig. 2). (B) Simulations with a different level of noise (〈ν2〉 = 2. (C) Without delays. (D) For a different working point (α = 0.007 and ν = 3.5).
Fig. 4.
Fig. 4.
Sychronization analysis of simulated BOLD data. (A) (Left) BOLD signal for each of the 2 single communities (community 1, black; community 2, red; difference, blue). (Right) Power spectrum of the BOLD signal given by the differences between the level of BOLD signal between both communities. (B) (Left) Level of synchronization (blue curves) and BOLD signals (black curves) for each of the single communities. The black curves are identical to the black and red curves of A. (Right) Respective cross-temporal correlations between synchronization and BOLD signals. Note the typical hemodynamics-based delay between 1 and 3 s.
Fig. 5.
Fig. 5.
Stochastic Resonance Effects. (A) Maximum of the power spectrum peak of the signal given by differences between the level of synchronization between both communities versus the noise level (variance). (B) Maximum in the power spectrum of the signal given by differences between the level of synchronization between both communities versus the noise level. (C) Correlation between the level of synchronization between both communities versus the noise level. Note the stochastic resonance effect that for the same level of fluctuations reveals the optimal emergence of 0.1-Hz global slow oscillations and the emergence of anticorrelated spatiotemporal patterns for both communities. Points (diamonds) correspond to numerical simulations, whereas the line corresponds to a nonlinear least-squared fitting using an α-function.

References

    1. Arieli A, Sterkin A, Grinvald A, Aertsen A. Dynamics of ongoing activity: Explanation of the large variability in evoked cortical responses. Science. 1996;273:1868–1871. - PubMed
    1. Biswal B, Yetkin F, Haughton V, Hyde J. Functional connectivity in the motor cortex of resting human brain using echo-planar MRI. Magn Reson Med. 1995;34:537–541. - PubMed
    1. Shulman G, et al. Common blood flow changes across visual tasks: II. Decreases in cerebral cortex. J Cognit Neurosci. 1997;9:648–663. - PubMed
    1. Gusnard D, Raichle M. Searching for a baseline: Functional imaging and the resting human brain. Nat Rev Neurosci. 2001;2:685–694. - PubMed
    1. Raichle M, Mintun M. Brain work and brain imaging. Annu Rev Neurosci. 2006;29:449–476. - PubMed