

The water footprint of bioenergy
- PMID: 19497862
- PMCID: PMC2690604
- DOI: 10.1073/pnas.0812619106
The water footprint of bioenergy
Abstract
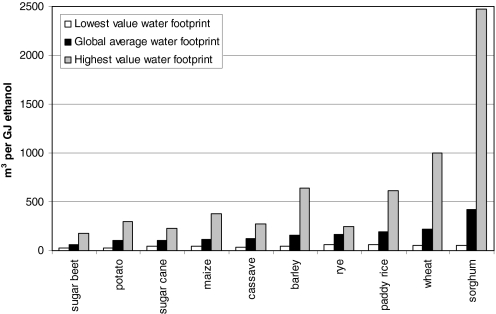
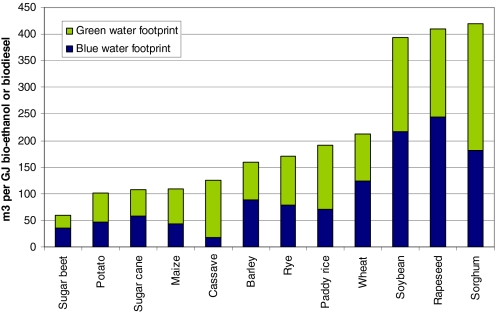
All energy scenarios show a shift toward an increased percentage of renewable energy sources, including biomass. This study gives an overview of water footprints (WFs) of bioenergy from 12 crops that currently contribute the most to global agricultural production: barley, cassava, maize, potato, rapeseed, rice, rye, sorghum, soybean, sugar beet, sugar cane, and wheat. In addition, this study includes jatropha, a suitable energy crop. Since climate and production circumstances differ among regions, calculations have been performed by country. The WF of bioelectricity is smaller than that of biofuels because it is more efficient to use total biomass (e.g., for electricity or heat) than a fraction of the crop (its sugar, starch, or oil content) for biofuel. The WF of bioethanol appears to be smaller than that of biodiesel. For electricity, sugar beet, maize, and sugar cane are the most favorable crops [50 m(3)/gigajoule (GJ)]. Rapeseed and jatropha, typical energy crops, are disadvantageous (400 m(3)/GJ). For ethanol, sugar beet, and potato (60 and 100 m(3)/GJ) are the most advantageous, followed by sugar cane (110 m(3)/GJ); sorghum (400 m(3)/GJ) is the most unfavorable. For biodiesel, soybean and rapeseed show to be the most favorable WF (400 m(3)/GJ); jatropha has an adverse WF (600 m(3)/GJ). When expressed per L, the WF ranges from 1,400 to 20,000 L of water per L of biofuel. If a shift toward a greater contribution of bioenergy to energy supply takes place, the results of this study can be used to select the crops and countries that produce bioenergy in the most water-efficient way.
Conflict of interest statement
The authors declare no conflict of interest.
Figures
Comment in
-
Use of inadequate data and methodological errors lead to an overestimation of the water footprint of Jatropha curcas.Proc Natl Acad Sci U S A. 2009 Aug 25;106(34):E91. doi: 10.1073/pnas.0906788106. Epub 2009 Aug 24. Proc Natl Acad Sci U S A. 2009. PMID: 19706498 Free PMC article. No abstract available.
-
The water footprint of bioenergy from Jatropha curcas L.Proc Natl Acad Sci U S A. 2009 Sep 1;106(35):E92. doi: 10.1073/pnas.0907272106. Epub 2009 Aug 26. Proc Natl Acad Sci U S A. 2009. PMID: 19717469 Free PMC article. No abstract available.
-
The water "shoesize" vs. footprint of bioenergy.Proc Natl Acad Sci U S A. 2009 Sep 1;106(35):E93-4. doi: 10.1073/pnas.0908069106. Epub 2009 Aug 26. Proc Natl Acad Sci U S A. 2009. PMID: 19717470 Free PMC article. No abstract available.
References
-
- Postel SL, Daily GC, Ehrlich PR. Human appropriation of renewable freshwater. Science. 1996;271:785–788.
-
- Gleick PH. The human right to water. Water Policy. 1998;1:487–503.
-
- Postel SL. Entering an era of water scarcity: The challenges ahead. Ecol Appl. 2000;10:941–948.
-
- United Nations. World Population Prospects: The 2006 Revision, Highlights, Working Paper No. ESA/P/WP. Vol. 202. United Nations, New York: Department of Economic and Social Affairs, Population Division; 2007.
-
- Fischer G, Shah M, van Velthuizen H, Nachtergaele FO. Global Agro-Ecological Assessment for Agriculture in the 21st Century. Laxenburg, Austria: Int Inst Appl Syst Anal; 2001.
MeSH terms
Substances
LinkOut - more resources
Full Text Sources
