. 2009 Jun 16;106(24):9655-60.
doi: 10.1073/pnas.0902515106. Epub 2009 Jun 2.

Dynamic histone H3 epigenome marking during the intraerythrocytic cycle of Plasmodium falciparum

Affiliations

Dynamic histone H3 epigenome marking during the intraerythrocytic cycle of Plasmodium falciparum

Adriana M Salcedo-Amaya et al. Proc Natl Acad Sci U S A. .

Abstract

Epigenome profiling has led to the paradigm that promoters of active genes are decorated with H3K4me3 and H3K9ac marks. To explore the epigenome of Plasmodium falciparum asexual stages, we performed MS analysis of histone modifications and found a general preponderance of H3/H4 acetylation and H3K4me3. ChIP-on-chip profiling of H3, H3K4me3, H3K9me3, and H3K9ac from asynchronous parasites revealed an extensively euchromatic epigenome with heterochromatin restricted to variant surface antigen gene families (VSA) and a number of genes hitherto unlinked to VSA. Remarkably, the vast majority of the genome shows an unexpected pattern of enrichment of H3K4me3 and H3K9ac. Analysis of synchronized parasites revealed significant developmental stage specificity of the epigenome. In rings, H3K4me3 and H3K9ac are homogenous across the genes marking active and inactive genes equally, whereas in schizonts, they are enriched at the 5' end of active genes. This study reveals an unforeseen and unique plasticity in the use of the epigenetic marks and implies the presence of distinct epigenetic pathways in gene silencing/activation throughout the erythrocytic cycle.


Conflict of interest statement

The authors declare no conflict of interest.

Figures
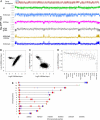
Fig. 1.
Fig. 1.
Profiling H3, H3K4me3, H3K9ac and H3K9me3. (A) ChIP-on-chip and transcriptome profiles. SignalMap view of the epigenetic landscape of chromosome 12. The data are plotted as log2 ratios of ChIP/input. Coordinates are according to GenBank annotation release May 2005. (B) Scatter plot of log2 ratios (ChIP/input) of H3K9ac versus H3K4me3. Each dot represents the median ratio calculated per gene. (C) As in B for H3K9ac vs. H3K9me3. (D) Boxplot distribution of genes grouped according to gene annotation and ranked by their log2 H3K9me3 median ratio calculated per gene. (E) Genomic localization of hypoacetylated/hypermethylated genes. The chromosomal map positions of hypoacetylated ‘outlier’ genes. In red: var, rifin, stevor, and pfmc-2tm genes and their pseudogenes. In blue: Other known-function and hypothetical protein genes that show a similar hypoacetylation/hypermethylation described in the text and Table S1.
Fig. 2.
Fig. 2.
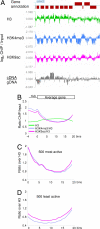
H3K4me3 and H3K9ac analysis in asexual RBC stages. (A) SignalMap view of a section of chromosome 2 as described in Fig. 2A showing increased marking at intergenic regions and depletion at ORFs. (B) Composite epigenetic profiles of H3, H3K4me3, and H3K9ac averaged over P. falciparum genes. The averaged gene organization is depicted. Only genes with gene-free upstream region larger than 0.8 kb and >4 probes spanning it were analyzed. Probes located within 0.8 kb upstream of the ORF were assigned into 5 bins of equal length. ORFs were divided into 20 bins. The middle position of the probe was used to assign probes to bins. (C) Composite profile of H3K4me3/H3 and H3K9ac/H3 ratios of the 500 highest expressed genes in iRBCs. Each ORF was divided into 20 bins of equal size. Genes larger than 0.8 kb with upstream gene-free region larger than 0.8 kb were used for the analysis. (D) As in C for the 500 least expressed genes.
Fig. 3.
Fig. 3.
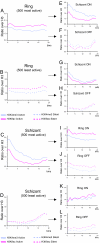
Distinct epigenetic marking of genes in the ring and schizont stages. (A) Composite profiles of H3K4me3/H3 and H3K9ac/H3 ratios of the 500 most active genes in rings. Each ORF was divided into 20 bins of equal size. Only genes larger than 0.8 kb with upstream gene-free region larger than 0.8 kb were taken for the analysis. (B) The 500 least-active genes in rings; (C) 500 most-active genes in schizonts; (D) 500 least active genes in schizonts. (E) Schizonts profile of genes that are active in rings and remain active in schizonts, and of F, genes that are active in rings and turn inactive in schizonts. (G) Schizont profile of genes that are inactive in rings and became active in schizonts and of H, genes that are inactive in rings and remain inactive in schizonts. (I and J) Ring profiles of genes as they switch from schizonts to rings, as described from E–H.

References

    1. Arnot DE, Gull K. The Plasmodium cell-cycle: Facts and questions. Ann Trop Med Parasitol. 1998;92:361–365. - PubMed
    1. Bozdech Z, et al. The transcriptome of the intraerythrocytic developmental cycle of Plasmodium falciparum. PLoS Biol. 2003;1:E5. - PMC - PubMed
    1. Le Roch KG, et al. Discovery of gene function by expression profiling of the malaria parasite life cycle. Science. 2003;301:1503–1508. - PubMed
    1. Florens L, et al. A proteomic view of the Plasmodium falciparum life cycle. Nature. 2002;419:520–526. - PubMed
    1. Lasonder E, et al. Analysis of the Plasmodium falciparum proteome by high-accuracy mass spectrometry. Nature. 2002;419:537–542. - PubMed

Publication types

Associated data