. 2009 Jun 16;106(24):9785-90.
doi: 10.1073/pnas.0902844106. Epub 2009 Jun 2.

Requirement for AHNAK1-mediated calcium signaling during T lymphocyte cytolysis

Affiliations

Requirement for AHNAK1-mediated calcium signaling during T lymphocyte cytolysis

Didi Matza et al. Proc Natl Acad Sci U S A. .

Abstract

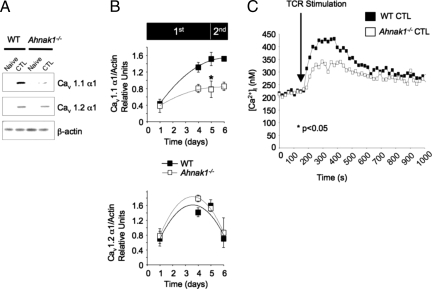
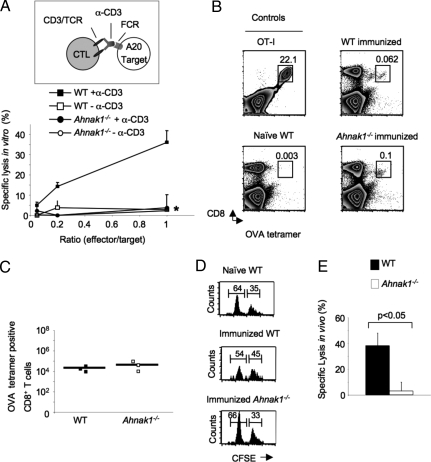
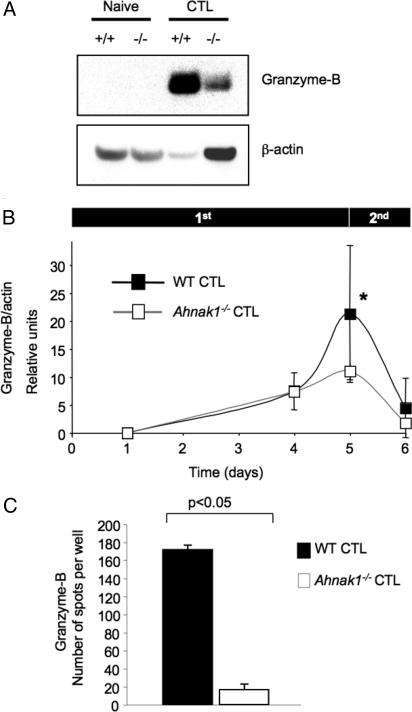
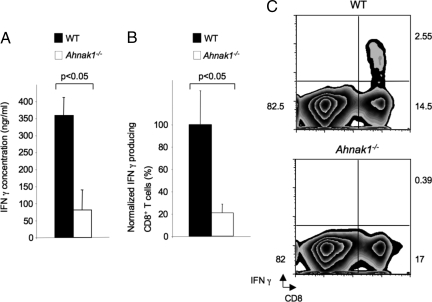
Cytolytic CD8(+) T cells (CTLs) kill virally infected cells, tumor cells, or other potentially autoreactive T cells in a calcium-dependent manner. To date, the molecular mechanism that leads to calcium intake during CTL differentiation and function has remained unresolved. We demonstrate that desmoyokin (AHNAK1) is expressed in mature CTLs, but not in naive CD8(+) T cells, and is critical for calcium entry required for their proper function during immune response. We show that mature AHNAK1-deficient CTLs exhibit reduced Ca(v)1.1 alpha1 subunit expression (also referred to as L-type calcium channels or alpha1S pore-forming subunits), which recently were suggested to play a role in calcium entry into CD4(+) T cells. AHNAK1-deficient CTLs show marked reduction in granzyme-B production, cytolytic activity, and IFN-gamma secretion after T cell receptor stimulation. Our results demonstrate an AHNAK1-dependent mechanism controlling calcium entry during CTL effector function.


Conflict of interest statement

The authors declare no conflict of interest.

Figures

Fig. 1.
Fig. 1.
Reduced Cav1.1 α1 subunit expression and calcium entry in response to TCR stimulation in Ahnak1−/− CTLs. (A) The expression of Cav1.1 and Cav1.2 was examined in purified naive CD8+ T cells and in mature CTLs 5 days after primary stimulation using plate-bound anti-CD3 and anti-CD28 (amount of antibodies is described in Fig. S1A) in wild-type and Ahnak1−/− cells. (B) Kinetics of Cav1.1 and Cav1.2 expression by immunoblot analysis [using anti-α1S (Cav1.1) and anti-α1C (Cav1.2)] was as described in Fig. S1B. Expression of Cav1.1 and Cav1.2 α1 subunit was normalized to β-actin for each time point. This final densitometry plot of Cav1.1 and Cav1.2 α1 subunit expression is an average of 3 independent experiments. There is a statistically significant difference in Cav1.1 expression, but not in Cav1.2, α1 subunit expression, between wild-type and Ahnak1−/− cells (*P < 0.05) at day 5 after primary stimulation. Experiment B was performed in addition to and was independent of experiment A. (C) CTLs from wild-type and Ahnak1−/− mice, obtained after 5 days of primary stimulation as in Fig. S1A, were incubated with anti-CD3 (10 μg/mL) for 30 min on ice and subsequently were cross-linked by goat anti-hamster at the indicated time (TCR stimulation). Then [Ca2+]i was measured by a ratiometric method using Fura-2 as a probe. An average of 3 independent experiments is shown (The individual experiments are shown in Fig. S4). There is statistically significant difference between wild-type and Ahnak1−/− cells (P < 0.05).
Fig. 2.
Fig. 2.
Ahnak1−/− CTLs show deficient cytolytic activity in vitro and in vivo. (A) Calcein-AM-loaded A20 were used as targets in the calcein-AM retention CTL assay, with wild-type or Ahnak1−/− CTLs at the noted effector/target ratios and redirected with anti-CD3. Results shown are mean (SD) for 3 individual mice tested per group. We obtained similar results from 2 similar independent experiments. There is a statistically significant difference between wild-type and Ahnak1−/− CTL killing (*, P < 0.05). (B and C) Wild-type dendritic cells, pulsed with H-2Kb-binding SIINFEKL peptide (OVA), were transferred into wild-type and Ahnak1−/− mice. Splenocytes were analyzed for CTL expansion in vivo by H-2kb/OVA257–264 (SIINFEKL) peptide tetramer staining 7 days later. A representative mouse is shown in B. An OT-I mouse is shown as positive control for the tetramer staining, and a naive wild-type mouse is shown as negative control. (C) An average absolute cell number was calculated for 3 individual mice. (D and E) Wild-type and Ahnak1−/− mice were immunized as in B. After 7 days, we co-transferred SIINFEKL peptide (OVA)-loaded CFSE-low-labeled (0.5 μM) mixed with unloaded CFSE-high (5 μM) target wild-type splenocytes. Splenocytes were harvested 3 h later and were analyzed by flow cytometry. Representative naive unimmunized wild-type control mice, immunized wild-type mice, and Ahnak1−/− mice are shown in D. The left and the right peaks shown in the histogram represent the peptide-loaded and unloaded target cells, respectively. Specific lysis was calculated from the ratio between peptide-loaded and unloaded target cells in unimmunized wild-type control and immunized wild-type or Ahnak1−/− mice. An average of 7 mice from each group is shown in E. Significant differences were found between wild-type and Ahnak1−/− mice (P < 0.05).
Fig. 3.
Fig. 3.
Reduced granzyme-B production in the absence of AHNAK1. (A) The expression of granzyme B was examined in wild-type and Ahnak1−/−-naive CD8+ T cells versus CTLs. (B) Kinetics of granzyme-B expression were obtained as in Fig. S1B. β-actin was used as the loading control. We performed 3 independent experiments. There is a statistically significant difference in granzyme-B expression in wild-type and Ahnak1−/− cells on the fifth day after primary stimulation (*, P < 0.05). Experiment B was performed in addition to and is independent of experiment A. (C) The granzyme-B ELISPOT assay was performed using wild-type or Ahnak1−/− CTLs, stimulated for 5 days as described in Fig. S1. We performed 3 independent experiments. There is a statistically significant difference in granzyme-B secretion in wild-type and Ahnak1−/− cells (P < 0.05).
Fig. 4.
Fig. 4.
In vivo and in vitro deficient IFN-γ production in the absence of AHNAK1. (A) Wild-type and Ahnak1−/− CTLs were obtained as in Fig. S1A, were washed, and were restimulated using plate-bound anti-CD3 only (2 μg/mL) for 24 h. Supernatants from in vitro-stimulated CD8+ T cells were collected, and IFN-γ production was measured by ELISA. Results shown are mean (SD) for 3 mice per group. There is a statistically significant difference between wild-type and Ahnak1−/− cells (P < 0.05). We obtained similar results with 2 other similar experiments. (B) Wild-type dendritic cells pulsed with H-2Kb-binding SIINFEKL peptide (OVA) were transferred into wild-type and Ahnak1−/− mice. Splenocytes were purified and restimulated in vitro with OVA for 6 h, and 7 days later CD8 and IFN-γ expression was analyzed by flow cytometry. The normalized percentages of IFN-γ-producing CD8+ T cells are shown. Results shown are mean (SD) for 6 mice per group. We performed 2 independent experiments. There is a statistically significant difference between wild-type and Ahnak1−/− cells (*P < 0.05). (C) Results from one representative wild-type and Ahnak1−/− are shown.

References

    1. Cantrell D. T cell antigen receptor signal transduction pathways. Annu Rev Immunol. 1996;14:259–274. - PubMed
    1. Lewis RS. Calcium signaling mechanisms in T lymphocytes. Annu Rev Immunol. 2001;19:497–521. - PubMed
    1. Berke G. Unlocking the secrets of CTL and NK cells. Immunol Today. 1995;16:343–346. - PubMed
    1. Esser MT, Haverstick DM, Fuller CL, Gullo CA, Braciale VL. Ca2+ signaling modulates cytolytic T lymphocyte effector functions. J Exp Med. 1998;187:1057–1067. - PMC - PubMed
    1. Lyubchenko TA, Wurth GA, Zweifach A. Role of calcium influx in cytotoxic T lymphocyte lytic granule exocytosis during target cell killing. Immunity. 2001;15:847–859. - PubMed

Publication types

LinkOut - more resources