. 2009 Aug;297(2):G278-91.
doi: 10.1152/ajpgi.00077.2009. Epub 2009 Jun 4.

Adrenergic activation of electrogenic K+ secretion in guinea pig distal colonic epithelium: desensitization via the Y2-neuropeptide receptor

Affiliations

Adrenergic activation of electrogenic K+ secretion in guinea pig distal colonic epithelium: desensitization via the Y2-neuropeptide receptor

Jin Zhang et al. Am J Physiol Gastrointest Liver Physiol. 2009 Aug.

Abstract

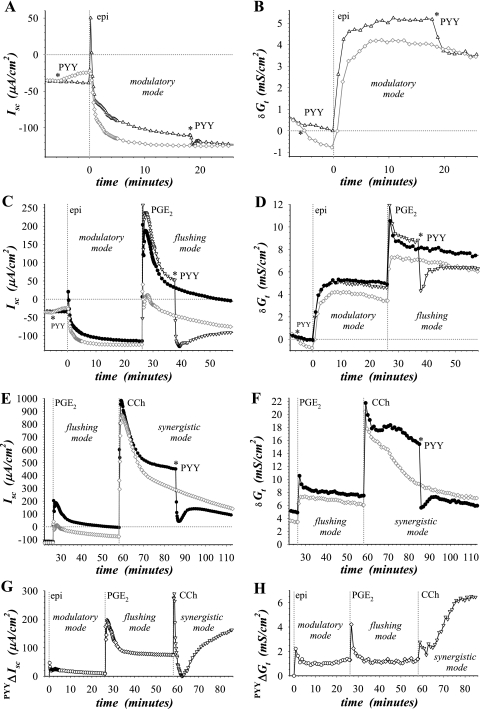
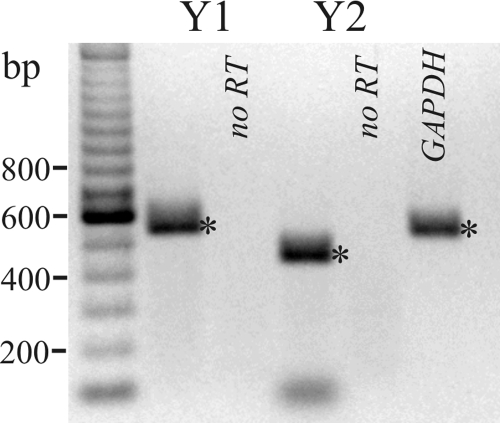
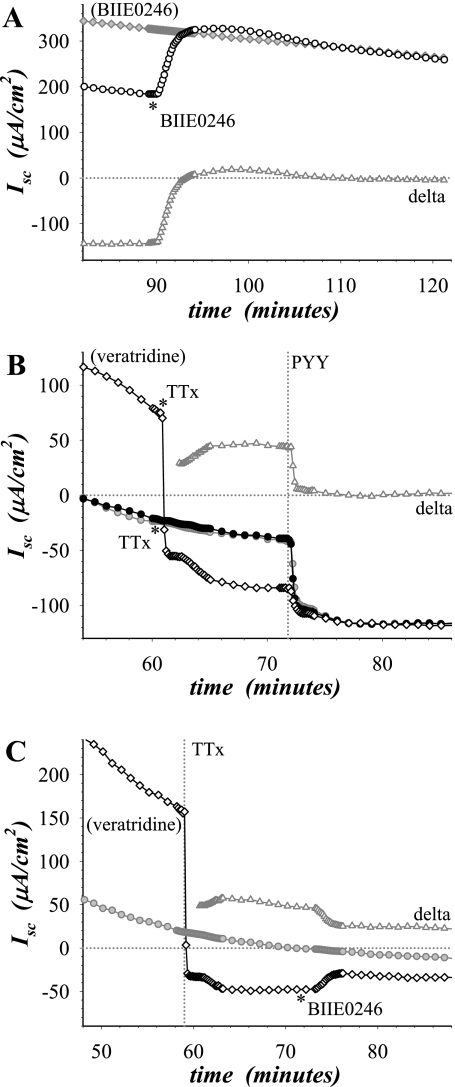
Adrenergic activation of electrogenic K+ secretion in isolated mucosa from guinea pig distal colon was desensitized by peptide-YY (PYY). Addition of PYY or neuropeptide-Y (NPY) to the bathing solution of mucosae in Ussing chambers suppressed the short-circuit current (Isc) corresponding to electrogenic Cl- secretion, whether stimulated by epinephrine (epi), prostaglandin-E2 (PGE2), or carbachol (CCh). Neither peptide markedly inhibited the large transient component of synergistic secretion (PGE2 + CCh). Sustained Cl- secretory Isc was inhibited approximately 65% by PYY or NPY, with IC50s of 4.1 +/- 0.9 nM and 9.4 +/- 3.8 nM, respectively. This inhibition was eliminated by BIIE0246, an antagonist of the Y2-neuropeptide receptor (Y2-NpR), but not by Y1-NpR antagonist BVD10. Adrenergic sensitivity for activation of K+ secretion in the presence of Y2-NpR blockade by BIIE0246 was (EC50s) 2.9 +/- 1.2 nM for epi and 13.3 +/- 1.0 nM for norepinephrine, approximately fourfold greater than in the presence of PYY. Expression of mRNA for both Y1-NpR and Y2-NpR was indicated by RT-PCR of RNA from colonic mucosa, and protein expression was indicated by immunoblot. Immunoreactivity (ir) for Y1-NpR and Y2-NpR was distinct in basolateral membranes of columnar epithelial cells in the crypts of Lieberkühn as well as intercrypt surface epithelium. Adrenergic nerves in proximity with crypts were detected by ir for dopamine-beta-hydroxylase, and a portion of these nerves also contained NPY(ir). BIIE0246 addition increased secretagog-activated Isc, consistent with in vitro release of either PYY or NPY. Thus PYY and NPY were able to suppress Cl- secretory capacity and desensitize the adrenergic K+ secretory response, providing a direct inhibitory counterbalance against secretory activation.


Figures

Fig. 1.
Fig. 1.
Each mode of secretory activation was sensitive to peptide-YY (PYY). Isolated mucosae were stimulated sequentially by adding epinephrine (epi) (5 μM), prostaglandin-E2 (PGE2) (3 μM), and carbachol (CCh) (10 μM) to the serosal bath, from the standard basal condition (see materials and methods). Short-circuit current (Isc) and transepithelial conductance (Gt) were measured in 4 adjacent mucosae (◊,▵, ▿, •) as PYY (1 μM) was added to the serosal bath during secretory activation (*). The time course was split into separate panels to aid viewing of each secretory mode, and the mucosae receiving PYY before secretagog stimulation (◊) was shown throughout. Gt was normalized by subtracting the basal value prior to stimulation (δGt), except for the mucosae pretreated with PYY (◊) for which the normalization was made to the preaddition level. The basal Gt for the 4 mucosae was 9.47 ± 38 mS/cm2. A and B: modulatory mode was activated by epi with one mucosa having PYY added before epi (◊) and the other after epi activation (▵). Each of the control mucosae (▵, ▿, •) had a transient positive Isc at the onset of epi activation. The peak transient ΔIsc and ΔGt for epi addition alone were significantly larger than in the presence of PYY (P < 0.05, N = 10), respectively, +119 ± 13 μA/cm2 and +20 ± 7 μA/cm2 as well as +2.78 ± 28 mS/cm2 and +0.93 ± 12 mS/cm2. Before epi addition, the changes in Isc and Gt attributable to PYY addition compared with control were significantly different from zero (P < 0.05, N = 10), respectively, +19 ± 3 μA/cm2 and −1.12 ± 0.17 mS/cm2. C and D: flushing mode activated by PGE2 was shown in the presence (◊) and absence (•) of PYY, and a third mucosa was shown (▿) with PYY added ∼12 min after PGE2 activation. E and F: synergistic mode was activated by adding CCh in the continued presence of PGE2. The action of PYY was assessed further by comparing the response in the presence of PYY (◊) to the mucosa receiving PYY ∼26 min after CCh activation (•). G and H: PYY-sensitive components of Isc (PYYΔIsc) and Gt (PYYΔGt) for each mode of secretory activation were calculated as the difference between mucosae with PYY absent and those with PYY present; these positive ΔIsc and ΔGt likely represented electrogenic Cl secretion. The responses were representative of 6 similar experiments.
Fig. 2.
Fig. 2.
Neuroendocrine peptides inhibited secretory Isc with high efficacy. Isolated mucosae were stimulated by sequential additions of epi (5 μM), PGE2 (3 μM), and CCh (10 μM) as in Fig. 1. Neuroendocrine peptides were added at increasing concentrations to the serosal bath in adjacent mucosa either during PGE2 (as in Fig. 1B) or CCh activation (as in Fig. 1C). Inhibitory responses were normalized to the Isc before addition compared with the sustained Isc during epi activation. Fractional inhibition was similar for both secretory modes so that the results were combined, neuropeptide-Y (NPY) (⧫, n = 3), PYY (•, n = 13), PYY(3-36) (○, n = 4). Antagonists to neuropeptide receptors [BVD10, Y1-neuropeptide receptor (Y1-NpR); □, n = 3] and (BIIE0246, Y2-NpR; ▿, n = 4) also were added (1 μM) for some mucosae before secretory activation and PYY addition. The fit of the data with a single binding site [NPY and PYY, solid line; PYY(3-36), dashed line; PYY + BVD10, gray dashed line] yielded IC50s of 4.1 ± 0.9 nM (PYY), 6.2 ± 1.9 nM [PYY(3-36)], and 9.4 ± 3.8 nM (NPY); maximal fractional inhibitions were 0.67 ± 0.03, 0.70 ± 0.05, and 0.58 ± 0.10, respectively. Neither the IC50s nor the maximal fractional inhibitions were significantly different among these peptides (P < 0.05). The Y1-NpR antagonist BIBP3226 (1 μM) also did not inhibit the action of PYY (data not shown).
Fig. 3.
Fig. 3.
NPY receptor mRNA detected by RT-PCR. RNA isolated from distal colonic mucosa was used to amplify Y1-NpR and Y2-NpR products by RT-PCR. Products were obtained at 546 base pairs (bp) for Y1-NpR and 442 base pairs for Y2-NpR as predicted from the position of the forward and reverse primers (indicated by asterisks), and amplification of GAPDH served as a positive control for RNA isolation. The negative control obtained by not including reverse transcriptase indicated the lack of contamination by genomic DNA. The faint band smaller than 100 bp likely was due to unused primers from the PCR.
Fig. 4.
Fig. 4.
NPY receptor proteins detected by immunoblot. Protein isolated from distal colonic epithelial cell membranes was immunoblotted with antibodies against the Y1-NpR and Y2-NpR proteins. Immunoreactive bands occurred at 43 kDa and 92 kDa for Y1-NpR and 55 kDa and 60 kDa for Y2-NpR (arrowheads), consistent with monomeric and possible oligomeric forms. Use of the secondary antibody alone eliminated all bands (data not shown), indicating that the primary antibodies were necessary for the observed results.
Fig. 5.
Fig. 5.
Y1-NpR proteins localized in the colonic epithelium. Y1-NpR was detected by immunofluorescence (anti-Y1-NpR) in distal colonic mucosa. A and B: surface epithelial cells had prominent immunoreactivity (Y1-NpRir) labeling of lateral membranes (arrowheads) without marked labeling of basal membranes (b). Labeling for apical membranes (a) was not apparent. Apically located goblet granule masses were apparent as dark voids (G). C and D: crypts showed distinct lateral membrane Y1-NpRir labeling (arrowheads), whereas the basal membrane lacked distinct labeling. Use of the secondary antibody alone eliminated all membrane labeling (data not shown), indicating that the primary antibodies were necessary for the observed results. Scale bars = 10 μm.
Fig. 6.
Fig. 6.
Y2-NpR proteins localized in the colonic epithelium. Y2-NpR was detected by immunofluorescence (anti-Y2-NpR) in distal colonic mucosa. A and B: surface epithelial cells had prominent Y2-NpRir labeling of lateral membranes (arrowheads) without marked labeling of basal membranes (b). Labeling for apical membranes (a) was not apparent. Apically located goblet granule masses were apparent as dark voids (G). C and D: crypts showed distinct lateral membrane labeling for Y2-NpRir (arrowheads), and luminal margins did not show labeling (lumen, L). Use of the secondary antibody alone eliminated all membrane labeling (data not shown), indicating that the primary antibodies were necessary for the observed results. Scale bars = 10 μm.
Fig. 7.
Fig. 7.
ATP and adenosine activated the modulatory mode of secretion. Isolated mucosae were stimulated by secretory agonists, from the standard basal condition as in Fig 1. A: Isc was measured in 3 adjacent mucosae with ATP (100 μM) added to the serosal (▾) or mucosal (▵) bath, or epi (shaded circles, 1 μM) added to the serosal bath. The responses were representative of 3 similar experiments (agonistΔIsc: transient ATPmucosal, −22 ± 2 μA/cm2; sustained ATPmucosal, −13 ± 4 μA/cm2; sustained ATPserosal, −31 ± 2 μA/cm2; sustained epi, −72 ± 9 μA/cm2; each response was significantly different from zero, ATP responses were significantly smaller than epi, and sustained ATPserosal response was significantly more negative than sustained ATPmucosal response, P < 0.05). B: Isc was measured in 2 adjacent mucosae as ATP (100 μM) and epi (1 μM) were added sequentially to the serosal bath with pretreatment either by PYY (○, 0.3 μM) or BIIE0246 (BIIE) (•, 1 μM). Difference in Isc between mucosae (▵) revealed the PYY-sensitive components. The responses were representative of 3 similar experiments (sustained ATPΔIsc for serosal addition was not significantly different with BIIE0246 compared with PYY, P < 0.05). C: Isc was measured in 3 adjacent mucosae as ATP (100 μM) was added either to the serosal (▾) or mucosal (▵) bath with pretreatment by the adenosine receptor antagonist CGS15943 (5 μM) (shaded circles, no addition control). The small positive change in Isc during the initial addition of CGS15943 may have resulted from blunting of a response to adenosine present in the bath (CGSΔIsc: +6 ± 1 μA/cm2, significantly different from zero, P < 0.05). The responses were representative of 3 similar experiments (agonistΔIsc: sustained ATPmucosal, −1 ± 1 μA/cm2; sustained ATPserosal, −4 ± 1 μA/cm2; ATPmucosal response was not significantly different from zero, ATPserosal response was significantly different from zero, but also significantly smaller than without CGS15943, P < 0.05). D: Isc was measured in 3 adjacent mucosae with adenosine (100 μM) added to the serosal (▾) or mucosal (▵) bath, or epi (shaded circles, 1 μM) added to the serosal bath. The responses were representative of 4 similar experiments (agonistΔIsc: mucosal adenosine, −12 ± 2 μA/cm2; serosal adenosine, −25 ± 8 μA/cm2; epi, −79 ± 13 μA/cm2; each response was significantly different from zero, and adenosine responses were significantly smaller than epi, P < 0.05).
Fig. 8.
Fig. 8.
Adrenergic and NPY-containing nerve types localized in the mucosa. Adrenergic and peptidergic nerves were detected in distal colon by ir for dopamine-β-hydroxylase (DβH) and NPY (anti-DβH, anti-NPY). A, B, and C: prominent immunoreactive labeling for DβH (green) and NPY (red) was apparent in the mucosa and muscularis mucosa with numerous points of colocalization (C, yellow). An apparent nerve bundle (arrowhead) crossed the muscularis mucosa into the mucosa. Nonspecific labeling of immune cells apparent in the interstitium were marked with asterisks. Scale bar = 40 μm. D: submucosa situated between the muscularis mucosa (mm) and the circular muscle had prominent points of DβHir and NPYir labeling with colocalization distinct around blood vessels (bv). Other nerve bundles did not show colocalization (arrowhead). Scale bar = 40 μm. E: myenteric plexus had prominent DβHir and NPYir labeling without colocalization. Scale bar = 40 μm. F: apparent nerve bundle lay between the muscularis mucosa and the base of crypts and extended between crypts (arrowhead) with points of colocalized DβHir and NPYir labeling seen throughout the nerve bundle course. Another nerve bundle was apparent crossing the muscularis mucosa (asterisk). Scale bar = 40 μm. G: crypt from C is shown enlarged with apparent nerve fibers parallel to the crypt axis. Scale bar = 20 μm. HK: nerve fibers were apparent often parallel to the crypt axis with either colocalization of DβHir and NPYir labeling or only labeling for one of these markers (arrowheads). Muscularis mucosa is at the bottom of each panel with the crypt axis vertical; scale bar = 20 μm. L: region near the yellow puncta indicated in K (arrowhead) was enlarged. The z-axis profiles through the puncta confirmed colocalization. A line scan of fluorescence intensity across this puncta (inset) indicated overlap of the peaks for both wavelengths, as well as a neighboring red puncta with only NPY labeling that lacked overlap. Use of each primary antibody alone, together with both secondary antibodies led to loss of labeling from the unmatched secondary antibody (data not shown), indicating that the primary antibodies were necessary for the observed labeling and that overlap did not occur between the fluorescence channels. Labeling of apparent immune cells (asterisks, C) was nonspecific because it occurred in the absence of primary antibodies.
Fig. 9.
Fig. 9.
Secretory Isc suppressed by endogenous sources. Isolated mucosae were stimulated by secretory agonists, from the standard basal condition as in Fig 1. A: Isc was measured in 2 adjacent mucosae after secretory activation by CCh (10 μM) followed by PGE2 (3 μM) with either no pretreatment (○) or BIIE0246 (1 μM) preaddition to the serosal bath (shaded diamond); time was from the addition of CCh. BIIE0246 was added at asterisk. Differences of Isc between these mucosae (▵) revealed the Y2-NpR-dependent component. The ΔIsc and ΔGt responses to BIIE0246 during synergistic secretion were +80 ± 28 μA/cm2 and +1.63 ± 0.36 mS/cm2 (significantly different from zero; P < 0.5, N = 6, n = 13). B: Isc was measured in 3 adjacent mucosae (shaded circle, ◊) after secretory activation by epi (5 μM) followed by PGE2 (3 μM). One mucosa (◊) was pretreated with veratridine (10 μM), and two (shaded circle, ◊) had tetrodotoxin (TTx) added at 1 μM (*); time was from the addition of veratridine. PYY (1 μM) was added subsequently to all mucosae. Difference of Isc between mucosae (▵) revealed the neural-dependent component. The veratridine-inhibited ΔIsc and ΔGt in the presence of TTx were +45 ± 2 μA/cm2 and +2.36 ± 0.69 mS/cm2 (significantly different from zero; P < 0.5, N = 4). C: Isc was measured in 2 adjacent mucosae (shaded circle, ◊) after secretory activation by epinephrine (5 μM) followed by PGE2 (3 μM). One mucosa was pretreated with veratridine (10 μM) (◊); time was from the addition of veratridine. After TTx (1 μM) addition (shaded circle, ◊), BIIE0246 (1 μM) was added (*) to the veratridine-treated mucosa (◊). Difference of Isc between mucosae (▵) revealed a Y2-NpR-dependent component. The responses were representative of 3 similar experiments (response to BIIE0246 was significantly different from zero, P < 0.05).
Fig. 10.
Fig. 10.
PYY altered the secretory sensitivity to epi and norepi. Isolated mucosae were stimulated by increasing concentrations of either epi or norepi, from the standard basal condition as in Fig 1. A: 4 mucosae from each animal (N = 5) were paired for pretreatment with either BIIE0246 (◊, ○; 1 μM) or PYY (⧫, •; 0.3 μM), and then Isc was recorded during addition of either norepi (◊, ⧫) or epi (○, •). The fit of the data with a single binding site (epi, black lines; norepi, gray lines; PYY, solid lines; BIIE0246, dashed lines) yielded EC50s of 2.9 ± 1.2 nM (BIIE/epi), 13.3 ± 1.0 nM (BIIE/norepi), 12.8 ± 1.3 nM (PYY/epi), and 39.8 ± 8.4 nM (PYY/norepi). Maximal secretory Isc values were −119 ± 12 μA/cm2 (BIIE/epi), −123 ± 13 μA/cm2 (BIIE/norepi), −133 ± 9 μA/cm2 (PYY/epi), and −144 ± 10 μA/cm2 (PYY/norepi). The EC50s for epi and norepi in the presence of PYY were significantly larger than those with BIIE0246 (P < 0.05), respectively, +9.9 ± 2.9 nM and +26.5 ± 8.7 nM. The EC50s for epi compared with norepi were significantly larger with either BIIE0246 or PYY (P < 0.05), respectively, +10.4 ± 1.6 nM and +27.0 ± 9.5 nM. Maximal Iscs for epi and norepi in the presence of PYY were significantly more negative than those with BIIE0246 (P < 0.05), respectively, −14 ± 3 μA/cm2 and −21 ± 6 μA/cm2. Maximal Iscs for epi compared with norepi were not significantly different with either BIIE0246 or PYY (P < 0.05). B: EC50s of the Isc responses to norepi and epi in the presence of BIIE0246 and PYY were compared with those from untreated guinea pig distal colonic mucosa (shaded circle; 52), rabbit distal colonic mucosa (shaded square; 42), and the three β-adrenergic receptors (▵,▿, ◊; 41).
Fig. 11.
Fig. 11.
β1 and β2 subtype selective antagonists inhibited Isc synergistically. Isolated mucosae were stimulated by increasing concentrations of epi as in Fig 9. A: 4 mucosae from each animal were pretreated with PYY (0.3 μM) and a β-adrenergic antagonist (1 μM) either CGP20712A (▿, N = 10), ICI-118551 (◊, N = 10), SR59320A (▵, N = 4), or no antagonist control (•, N = 10). The epiEC50s were 13.7 ± 2.5 nM (control), 18.6 ± 5.4 nM (CGP20712A), 104 ± 12 nM (ICI-118551), and 17.7 ± 5.2 nM (SR59320A). The epiEC50 with ICI-118551 was significantly larger than control (P < 0.05). Inhibition constants (Kd) were calculated from epiEC50s obtained with antagonists, assuming competitive antagonism (40); Kds were 2800 ± 690 nM (CGP20712A), 152 ± 31 nM (ICI-118551), and 439 ± 89 nM (SR59320A). B: 4 mucosae from each animal were pretreated with BIIE0246 (1 μM) and a β-adrenergic antagonist (1 μM) as in A. The epiEC50s were 4.4 ± 0.9 nM (control, N = 10), 3.6 ± 0.9 nM (CGP20712A, N = 10), 44.7 ± 3.8 nM (ICI-118551, N = 10), and 6.9 ± 2.4 nM (SR59320A, N = 4). The epiEC50 with ICI-118551 was significantly larger than control (P < 0.05). The corresponding Kds were 109 ± 9 nM (ICI-118551), 1,230 ± 420 nM (SR59320A), and for CGP20712A was indeterminate but likely >3 μM. C: 4 mucosae from each animal (N = 6) were pretreated with PYY (0.3 μM) and β-adrenergic antagonists (1 μM) either CGP20712A (▿), ICI-118551 (◊), CGP20712A + ICI-118551 (○), or no addition control (•). The epiEC50s were 18.0 ± 5.5 nM (control), 22.0 ± 7.4 nM (CGP20712A), 115 ± 15 nM (ICI-118551), and 535 ± 65 nM (CGP + ICI). The predicted epiEC50 (black dotted line) for a single binding site including competitive antagonism from CGP20712A and ICI-118551 (40) using the Kds determined from A was 121 ± 13 nM. The measured epiEC50 for combined addition of CGP20712A and ICI-118551 was significantly higher (4.41 ± 0.99 fold, P < 0.05) than this predicted value for these 2 competitive antagonists acting at a single site. D: 4 mucosae from each animal (N = 6) were pretreated with BIIE0246 (1 μM) and antagonists as in C. The epiEC50s were 3.9 ± 1.1 nM (control), 2.8 ± 0.9 nM (CGP20712A), 46.0 ± 5.6 nM (ICI-118551), and 205 ± 66 nM (CGP + ICI). This measured epiEC50 for combined addition of CGP20712A and ICI-118551 was significantly higher (4.33 ± 1.24 fold, P < 0.05) than the predicted value for these 2 competitive antagonists acting at a single site, 47.4 ± 9.9 nM.
Fig. 12.
Fig. 12.
Neural activation of modulatory mode electrogenic ion secretion. The colonic epithelium is shown schematically with an L cell (PYY releasing) of the enteroendocrine cell population between two columnar cells. The ion transport proteins necessary for electrogenic K+ and Cl secretion are indicated together with the receptor types examined in this study (β1-AdrR, β2-AdrR, Y2-NpR, A2B-AdoR, P2R). The upper columnar cell is secreting K+ and Cl, as illustrated by shading of the channels. Receptors that can activate this modulatory K+ and Cl secretion are shaded. The lower columnar cell is secreting only K+ because of the activation of Y2-NpR that suppresses Cl secretion. Apical membrane A2B or P2 receptors also activate K+ secretion without accompanying Cl secretion. Nerve processes with neurotransmitter-containing varicosities near the epithelial cells are shown from three populations, sympathetic inhibitory neurons (norepi, NPY, ATP), sympathetic secreto-inhibitory neurons (norepi), and cholinergic secretomotor neurons (ACh, NPY). Other ion transport proteins and receptors are present but were omitted for clarity.

Similar articles

Cited by

References

    1. Anderson GP Current issues with β2-adrenoceptor agonists: pharmacology and molecular and cellular mechanisms. Clin Rev Allergy Immunol 31: 119–130, 2006. - PubMed
    1. Ballantyne GH, Goldenring JR, Savoca PE, Kranz HK, Adrian TE, Bilchik AJ, Modlin IM. Cyclic AMP-mediated release of peptide YY (PYY) from the isolated perfused rabbit distal colon. Regul Pept 47: 117–126, 1993. - PubMed
    1. Barrett KE, Huott PA, Shah SS, Dharmsathaphorn K, Wasserman SI. Differing effects of apical and basolateral adenosine on colonic epithelial cell line T84. Am J Physiol Cell Physiol 256: C197–C203, 1989. - PubMed
    1. Berglund MM, Hipskind PA, Gehlert DR. Function, Distribution and Molecular Pharmacology of Npy-Family Receptors: The Npy Family of Peptides in Immune Disorders, Inflammation, Angiogenesis and Cancer, edited by Zukowska Z, Feuerstein GZ. Boston: Birkhäuser Verlag, 2005, p. 29–62.
    1. Brechet S, Plaisancié P, Dumoulin V, Chayvialle JA, Cuber JC, Claustre J. Involvement of β1- and β2- but not β3-adrenoceptor activation in adrenergic PYY secretion from the isolated colon. J Endocrinol 168: 177–183, 2001. - PubMed

Publication types

MeSH terms