. 2009 Sep;150(9):4114-23.
doi: 10.1210/en.2009-0065. Epub 2009 Jun 4.

The effect of angiotensin-converting enzyme inhibition using captopril on energy balance and glucose homeostasis

Affiliations

The effect of angiotensin-converting enzyme inhibition using captopril on energy balance and glucose homeostasis

Annette D de Kloet et al. Endocrinology. 2009 Sep.

Abstract

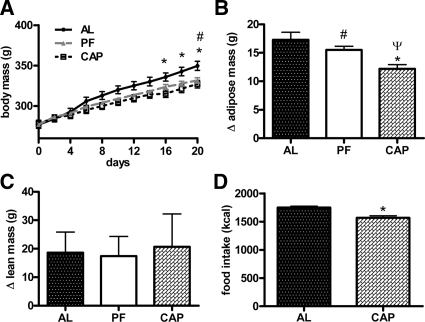
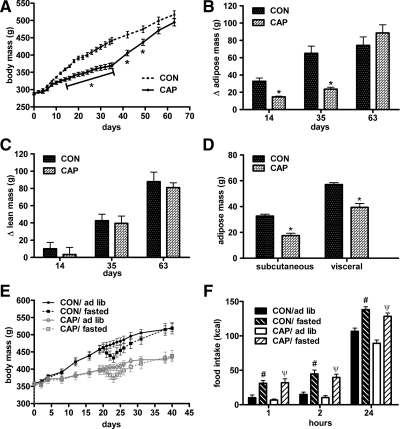
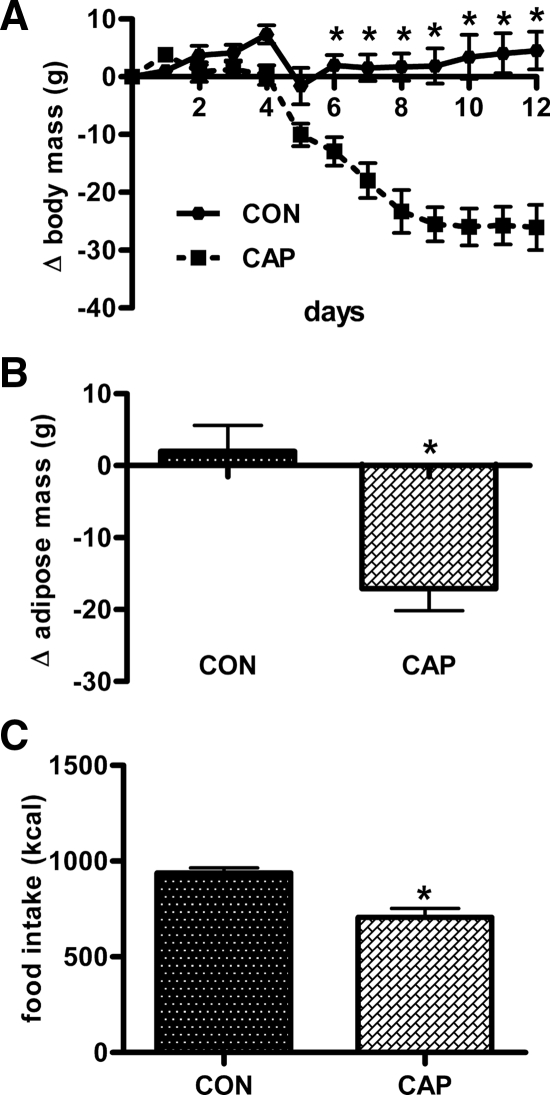
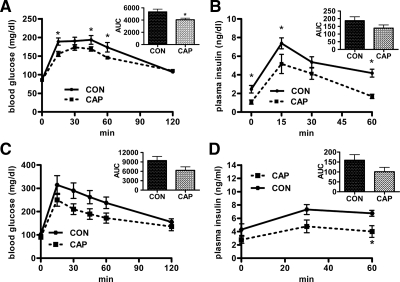
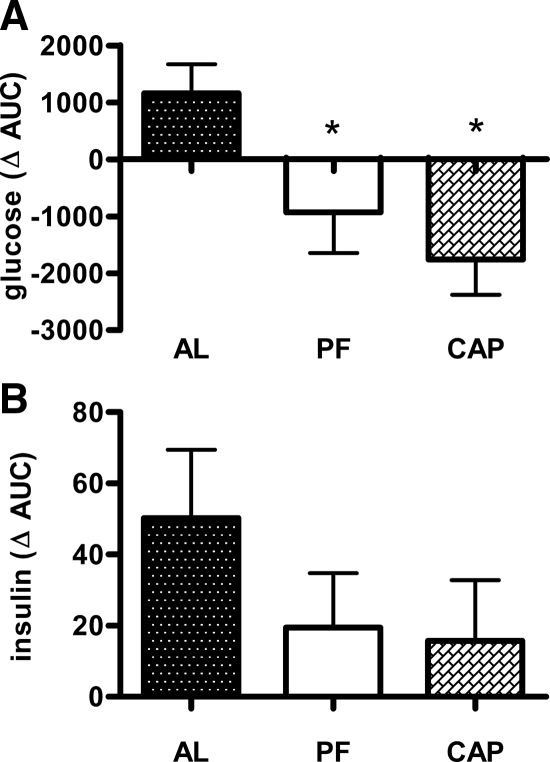
Increasing evidence suggests that the renin-angiotensin-system contributes to the etiology of obesity. To evaluate the role of the renin-angiotensin-system in energy and glucose homeostasis, we examined body weight and composition, food intake, and glucose tolerance in rats given the angiotensin-converting enzyme inhibitor, captopril ( approximately 40 mg/kg . d). Rats given captopril weighed less than controls when fed a high-fat diet (369.3 +/- 8.0 vs. 441.7 +/- 8.5 g after 35 d; P < 0.001) or low-fat chow (320.1 +/- 4.9 vs. 339.8 +/- 5.1 g after 21 d; P < 0.0001). This difference was attributable to reductions in adipose mass gained on high-fat (23.8 +/- 2.0 vs. 65.12 +/- 8.4 g after 35 d; P < 0.0001) and low-fat diets (12.2 +/- 0.7 vs. 17.3 +/- 1.3 g after 21 d; P < 0.001). Rats given captopril ate significantly less [3110.3 +/- 57.8 vs. 3592.4 +/- 88.8 kcal (cumulative 35 d high fat diet intake); P < 0.001] despite increased in neuropeptide-Y mRNA expression in the arcuate nucleus of the hypothalamus and had improved glucose tolerance compared with free-fed controls. Comparisons with pair-fed controls indicated that decreases in diet-induced weight gain and adiposity and improved glucose tolerance were due, primarily, to decreased food intake. To determine whether captopril caused animals to defend a lower body weight, animals in both groups were fasted for 24 h and subsequently restricted to 20% of their intake for 2 d. When free food was returned, captopril and control rats returned to their respective body weights and elicited comparable hyperphagic responses. These results suggest that angiotensin-converting enzyme inhibition protects against the development of diet-induced obesity and glucose intolerance.


Figures

Figure 1
Figure 1
Mean body mass (A), change in adipose mass (B), and change in lean mass (C) of low-fat chow-fed rats given captopril in their drinking water (∼40 mg/kg · d) for 21 d and controls. D, Mean cumulative food intake over 21 d. AL, Free-fed controls; PF, pair-fed controls; CAP, captopril-treated rats. *, CAP significantly different from AL (P < 0.05); ψ, CAP significantly different from PF (P < 0.05); #, PF significantly different from AL (P < 0.05) (n = 10/group). Bars, 1 sem.
Figure 2
Figure 2
Mean body mass (A), change in adipose mass (B), and change in lean mass (C) of rats given captopril (CAP) and controls (CON) during and after captopril administration. D, The distribution of adipose mass in the sc vs. visceral depots in rats given captopril for 42 d and controls. E, Mean body mass in rats given captopril and controls fed the HFD ad libitum or subjected to a food-restriction paradigm starting on d 20 of captopril administration. F, Food intakes of these rats given captopril after the food restriction paradigm when food was returned ad libitum. *, Significantly different from controls (P < 0.05); #, CON/fasted group is significantly different from CON/ad libitum-fed group (P < 0.05); ψ, CAP/fasted group is significantly different from CAP/ad libitum-fed group (P < 0.05) (n = 8/group). Bars, 1 sem.
Figure 3
Figure 3
Mean body mass (A), change in adipose mass (B), and cumulative food intake (C) in rats given captopril (CAP; ∼40 mg/kg · d in their drinking water) and controls (CON). Rats were previously rendered obese by the consumption of HFD. *, significantly different from controls (P < 0.05) (n = 8/group). Bars, 1 sem.
Figure 4
Figure 4
The effect of captopril (CAP) administration (∼40 mg/kg · d in their drinking water) on glucose tolerance in rats fed the HFD. In A and B rats were given access to HFD starting on d 4 of captopril administration, whereas in C and D rats were previously rendered obese via the consumption of HFD and were maintained on HFD throughout. Blood glucose levels (A) and plasma insulin levels (B) of rats during an oGTT in rats given captopril for 35 d and controls (CON) and the AUC of these blood glucose (A; inset) and plasma insulin (B; inset) responses (n = 10/group); the blood glucose (C) and plasma insulin (D) response during the ip GTT of rats given captopril for 5d and controls. (n = 8/group) The AUC of the blood glucose (E; inset) and plasma insulin (F; inset) response to the ip GTT. *, Significantly different from controls (P < 0.05). Bars, 1 sem.
Figure 5
Figure 5
The effect of sc captopril administration (∼40 mg/kg · d sc) on glucose tolerance in rats fed the HFD. Change in AUC of the blood glucose response (A) and the plasma insulin response (B) to the ip GTT from d 0 to d 11 in rats given captopril and controls. AL, Free-fed controls; PF, pair-fed controls; CAP, captopril-treated rats. *, Significantly different from the AL (P < 0.05) (n = 10/group). Bars, 1 sem.
Figure 6
Figure 6
The effect of icv captopril administration on food intake in rats administered captopril-laced drinking water (∼40 mg/kg · d) for 5 d or plain drinking water. Rats were fed low-fat chow. Immediately before the onset of dark, rats were additionally given icv captopril (CAP) or saline vehicle (VEH), and 2-h food intake was monitored. *, Significantly different from all other groups (P < 0.05) (n = 12/group). Bars, 1 sem.

References

    1. Woods SC, Seeley RJ, Porte Jr D, Schwartz MW 1998 Signals that regulate food intake and energy homeostasis. Science 280:1378–1383 - PubMed
    1. Schwartz MW, Woods SC, Porte Jr D, Seeley RJ, Baskin DG 2000 Central nervous system control of food intake. Nature 404:661–671 - PubMed
    1. Ogden CL, Carroll MD, Curtin LR, McDowell MA, Tabak CJ, Flegal KM 2006 Prevalence of overweight and obesity in the United States, 1999–2004. JAMA 295:1549–1555 - PubMed
    1. Massiera F, Seydoux J, Geloen A, Quignard-Boulange A, Turban S, Saint-Marc P, Fukamizu A, Negrel R, Ailhaud G, Teboul M 2001 Angiotensinogen-deficient mice exhibit impairment of diet-induced weight gain with alteration in adipose tissue development and increased locomotor activity. Endocrinology 142:5220–5225 - PubMed
    1. Weisinger RS, Begg DP, Chen N, Jois M, Mathai ML, Sinclair AJ 2007 The problem of obesity: is there a role for antagonists of the renin-angiotensin system? Asia Pac J Clin Nutr 16:359–367 - PubMed

Publication types

MeSH terms